Researchers from the U.K. have developed an algorithm capable of detecting subtle changes in the spacing between arthritic joints on 3D-reconstructed CT scans better than even standard x-ray imaging can, according to an article published online June 18 in Scientific Reports.
Though x-ray remains the gold standard for assessing joints, it is incapable of detecting tiny alterations in the space between joint bones, noted first author Dr. Tom Turmezei, PhD, and colleagues from the University of Cambridge.
"In addition to their lack of sensitivity, 2D x-rays rely on humans to interpret them," Turmezei said in a press release. "Our ability to detect structural changes to identify disease early, monitor progression, and predict treatment response is frustratingly limited by this."
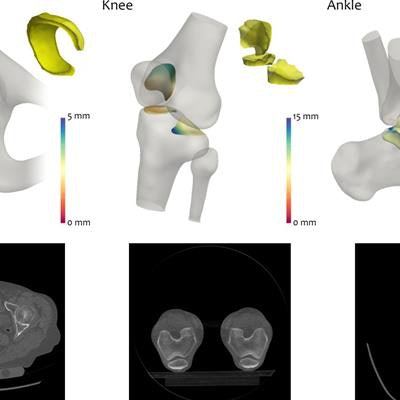
 The joint space mapping algorithm measures the space between joint bones on 3D CT scans. Image courtesy of Dr. Tom Turmezei, PhD.
To compensate for this shortcoming, the researchers designed their own joint space mapping technique, which involves a series of steps that ultimately determine the space between joint bones on 3D CT scans.
First, they acquired CT scans of the hip joints of 30 human cadavers and segmented and processed these scans following a standard 3D CT reconstruction protocol. Next, they used an algorithm that they developed within proprietary software (Stradwin 5.3) to project bone data values in 3D back onto the CT scans, map the joint space in 3D, and calculate the joint space volume.
After analyzing the data, the authors found that the semiautomated algorithm was able to detect small structural changes to the space between hip joint bones with at least two times the accuracy of x-ray imaging.
The joint space mapping technique could enable greater understanding of how certain types of joint diseases develop and allow the effectiveness of new treatments to be assessed more accurately, without the need for invasive tissue sampling, Turmezei said. What's more, the technique may allow clinicians not only to evaluate the joints of patients with arthritis but also to screen for arthritis as well.
"Using this technique, we'll hopefully be able to identify osteoarthritis earlier and look at potential treatments before it becomes debilitating," he said. "It could be used to screen at-risk populations, such as those with known arthritis, previous joint injury, or elite athletes who are at risk of developing arthritis due to the continued strain placed on their joints."