OSAKA - Emphysema, a progressively debilitating lung disease characterized by the destruction of alveoli, is a disease of smokers nearly 90% of the time, though it can also have a genetic basis in those with a hereditary deficiency of alpha1-antitrypsin.
Today nearly 2 million Americans have emphysema, the most common cause of respiratory deaths. The disease is responsible for some 45% of all lung transplantations, but it is not particularly easy to diagnose.
Chronic obstructive pulmonary disease, which includes emphysema, has been predicted to become the most common cause of death in the 21st century, said Takayuki Kitasaka, Ph.D., from Nagoya University in Japan.
On Friday at the Computer Assisted Radiology and Surgery (CARS) meeting, Kitasaka discussed his team's development and testing of a computer-aided detection (CAD) scheme to automate the diagnosis of emphysema with CT. In the final analysis, the results in their small database correlated strongly with the outcome of pulmonary function tests.
"There are two ways of diagnosing emphysema," Kitasaka said. "One is the pulmonary function test, and the other is image diagnosis using x-ray films or CT images."
 |
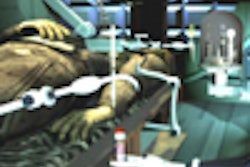
| CT demonstrates differences between lung parenchyma in a healthy subject (left) and a patient with emphysema (right). All images and charts courtesy of Takayuki Kitasaka, Ph.D. |
Common lung function tests include FEV1 (forced expiratory volume in 1 second), RV/TLC (RV = residual volume; TL = total lung capacity), and DLCO/VA (DLCO = carbon monoxide diffusing capacity; VA = alveolar ventilation). Emphysema is characterized by low-attenuation areas (LAA) on CT, which has recently been shown to be a useful tool in diagnosing emphysema.
In a CT diagnosis, the clinician evaluates the distribution of these low-attenuation regions, Kitasaka said. However, the evaluation is necessarily subjective, and the diagnosis varies widely, leading to the need for a reliable CAD method of assessing the disease.
A workable CAD would automatically extract the low-attenuating areas of the lung, calculate the severity index, and evaluate low-attenuation areas, he said.
 |
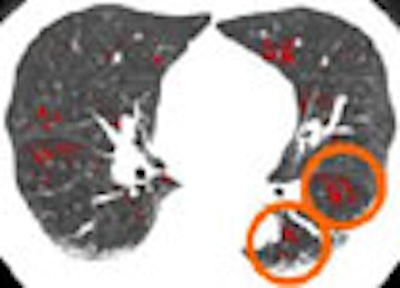
| With CAD, low-attenuation areas indicative of emphysema can be extracted automatically. |
"However, there is a problem in LAA extraction -- the CT value of lung parenchyma is biased due to gravity," Kitasaka said. The phenomenon results from acquiring CT images in the supine position, yielding blood flow and hence attenuation that are higher in the posterior regions of the lungs. "This unevenness leads to false negatives on the posterior side and false positives on the anterior side. Therefore, CT value correction is necessary," he said.
Previous methods coped with this effect by calculating correction values from a normal CT dataset. But this method is inadequate because the degree of change in CT values is different for every case.
Kitasaka and his colleagues aimed to even out the correction of attenuation differences in lung regions by designing an adaptive CT value correction method based on curve fitting that approximates the distribution of CT values in the lung. After correction, the low-attenuation areas are extracted from the corrected CT data.
In step 1, the lung, bronchus, and blood vessel data are extracted in preprocessing, the group explained in their abstract. The lung region is obtained by thresholding values followed by an opening-closing operation. The bronchus region is extracted by a region-growing method, and the thresholding operation is performed to extract the blood vessel region including the bronchial wall, they wrote.
Next, the mean CT value of each coronal section is calculated from the CT data of a subject with normal lungs, and this data is used to approximate the distribution of mean CT values. To eliminate outliers, a third polynomial is used to approximate the distribution of mean CT values of coronal sections containing obviously low-intensity (< -970 HU) voxels. Then a correction bias is calculated from the curve, and the curve [f(i)] is fitted to mean CT values. The correction value based on the curve is added to every image pixel on the i-th coronal section.
"The low-attenuation regions are extracted by a region growing method," Kitasaka said. Seed points are set to voxels in the lung lower than (a + b)/2 (where a and b are parameters set by the attenuation of the trachea and the fit curve). "Low-attenuation areas having sufficiently lower CT values have similar value to the trachea, that is the CT value of the air. So parameter a is set based on the CT value of the trachea," he said.
The middle of coronal section is neutral for gravity effect, and is set as the base section.
Following the application of their correction method, "the tendency of change in the CT value depends on each case," Kitasaka said.
 |
| Before correcting the attenuation for CT attenuation bias due to gravity, curve at left shows lower CT values in the anterior side, and higher CT values in the posterior side. After applying the proposed correction method (right), the tendency toward change in the CT values is determined separately for each case, and the bias is uniform for each case. |
Testing the results
Both the proposed correction method and the previous correction method were applied to 14 test cases. First, the results showed that the new method improved LAA extraction in eight of the 14 cases, according to Kitasaka.
The results were also evaluated by three pulmonary specialists, who rated the 14 LAA extractions as excellent (n = 3), fine (n = 9), bad (n = 1), and poor (n = 1).
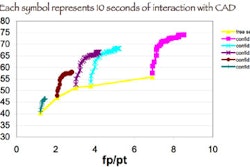
Finally, an analysis of the relationship between LAA percentage and pulmonary function tests showed that FEV1 and RV/TLC strongly correlated to LAA percentage. The results also showed a stronger correlation between LAA percentage and pulmonary function tests in the lower parts of the lung compared to the upper parts, consistent with previous clinical results. "The proposed method corrected CT values appropriately," Kitasaka said.
 |
| Analysis of the relationship between LAA percentage (ratio of LAA over lung area) and pulmonary function data showed that FEV1 and RV/TLC correlated strongly to LAA percentage and pulmonary function test data. There was a higher correlation between FEV1 percentage and LAA percentage in the lower parts of the lung compared to the upper parts, consistent with a clinical trial demonstrating that lesions in the lower regions are strongly correlated to a decrease of pulmonary function than in upper regions. |
The group plans to test the method on a larger number of patients, evaluate the CT features of emphysema, and do a more thorough analysis of the relationship between CT results and lung function data, according to Kitasaka.
Session moderator Dr. Matthew T. Freedman from the Georgetown University Medical Center in Washington, DC, complimented the study's thoroughness and its results, but cautioned that in addition to the gravity effects Kitasaka described, decreased lung volume and compression of the posterior lung in emphysema can also cause the CT attenuation gradient that the researchers sought to correct. The group might also examine the hypoventilative effect of severe emphysema and evaluate any effects on the model, Freedman said.
By Eric Barnes
AuntMinnie.com staff writer
July 2, 2006
Related Reading
MRI technique identifies early lung changes in smokers, June 5, 2006
Interlobar collaterals common in radiological homogeneous emphysema, June 5, 2006
Surgery better than rehab for improving BMD in emphysema patients, June 14, 2005
Management strategies evolve as CT finds more lung nodules, August 19, 2005
Emphysema alters CT appearance of benign nodules, May 4, 2005
Copyright © 2006 AuntMinnie.com