CAPE TOWN – MR fingerprinting (MRF) may help better assess early response to neoadjuvant chemotherapy in breast cancer treatment, according to research presented May 13 at the International Society for Magnetic Resonance in Medicine (ISMRM) meeting.
In her talk, Holly Marshall, MD, from University Hospitals Cleveland Medical Center in Ohio shared her team’s findings showing how this technique provided complementary information for characterizing tumor response. MRF also performed well in differentiating between pathological complete and non-complete responders.
“MR fingerprinting … has potential in early predicting in early treatment response after one cycle of neoadjuvant chemotherapy,” Marshall said.
MRF has emerged as a quantitative imaging technique that maps T1 and T2 relaxation times simultaneously. Marshall said 3D MRF methods could provide volumetric measurements with high spatial resolution, which could help better characterize treatment response within breast tumors being treated via neoadjuvant chemotherapy.
For their prospective study, Marshall and colleagues evaluated the performance of breast 3D MRF for assessing early treatment response in 42 women with breast cancer.
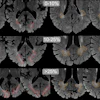
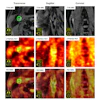
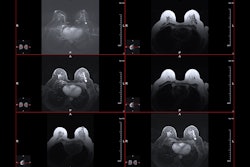
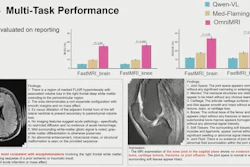
 Representative dynamic contrast enhanced (DCE)-MRI and MRF T1 and T2 maps obtained from a 52-year-old responder with invasive ductal carcinoma scanned at three time points. The DCE images acquired at both the baseline and third MRF scan are presented. The mean and standard deviation of the quantitative T1 and T2 values extracted from the region of interest analysis are shown at the bottom of the maps.
The researchers acquired three longitudinal 3T MRF scans for newly-diagnosed patients who were scheduled for chemotherapy. These included the following: initial scans to show baseline T1 and T2 values in each woman; second scans performed seven to 10 days after the first treatment cycle; and third scans performed within one month of completion of treatment, before any surgical procedures.
The team reported no significant differences in either T1 or T2 between pathologic complete and non-complete responders. However, it found significant reductions in both T1 and T2 values among the women between the first two scans.
MRF T1, T2 values comparison between baseline, second scans | |||||
Measure | Pathologic non-complete responders | Pathologic complete responders | P value | ||
| T1 values | T2 values | T1 values | T2 values |
|
Baseline | 1,155 msec | 66 msec | 1,200 msec | 74 msec | 0.6 (T1), 0.1 (T2) |
Second scans | 55 msec | –1 msec | –158 msec | –16 msec | <0.01 (T1), <0.001 (T2) |
Multivariable analysis showed that T1 and T2 values provided complementary information in differentiating pathologic complete versus non-complete response. This achieved the highest area under the receiver operating characteristic curve (AUC) value of 0.87, with a sensitivity of 80% and a specificity of 91%.
Marshall highlighted MRF’s advantage of having inherently co-aligned measures for multiple tissue properties. This helps avoid potential registration errors commonly linked to tissue property maps that are separately acquired.
“It could have a high impact on patient care in the care of aggressive types of breast cancer that require neoadjuvant chemotherapy,” Marshall said.
Get full coverage of ISMRM 2026 by visiting AuntMinnie’s ShowCast.