Breast imaging specialists continue to fine-tune the role of computer-aided detection (CAD) and/or classification (CAC). One international group, from New York and Israel, has looked at how useful computer software is to mammographers in two different ways: In their first study, they used CAD to compare the shape of individual microcalcifications to clusters as a whole in diagnostic breast imaging. In the second paper, they applied CAC specifically to notoriously ambiguous BI-RADS 3 breast lesions.
Geometry of the cluster
As a rule, properties such as shape, size, clustering, location, and density have been used to evaluate microcalcifications, with "linear rod-like and branching microcalcifications...highly suggestive of malignancy," wrote lead author Isaac Leichter, Ph.D., from the department of electro-optics at the Jerusalem College of Technology in Israel. Leichter’s co-authors included Dr. Shalom Buchbinder from the Montefiore Medical Center, Albert Einstein College of Medicine in New York City (American Journal of Roentgenology, March 2004, Vol. 182:3, pp. 705-712).
But while some microcalcifications identified with mammography are characteristic of malignancy, a lack of specificity is a problem and they may require biopsy, the authors stated. The group’s study evaluated computer-extracted features of microcalcifications to characterize clusters and possibly avoid biopsy.
For this retrospective study, 324 cases of mammographically detected microcalcifications with proven tumors (159 malignant, 165 benign) were reviewed. These selected cases were analyzed by radiologists at Montefiore, Staten Island University Hospital in New York City, and Hadassah University Hospital in Jerusalem.
The CAD system digitized the mammograms and extracted quantitative features of the lesions. A radiologist then demarcated the lesion and the entire radiograph was digitized at 72 dpi with 256 gray levels. Once the area containing the cluster of microcalcifications was identified, the region of interest (ROI) was digitized again at 600 dpi or 42 mm pixels.
Adjacent pairs of microcalcifications were identified by defining a polygonal "zone of influence" for each cluster, the authors explained. In some cases, a microcalcification was the nearest neighbor of several other microcalcifications and were all considered adjacent pairs, thereby generating the triangulation lines of Delaunay. The features of the clusters that were analyzed were the average number of neighbors, eccentricity, and shape. A pattern-recognition scheme was devised.
 |
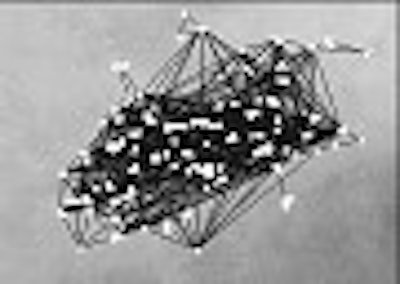
Digital image shows malignant cluster in which both shape of individual microcalcifications and cluster geometry indicate malignancy. Patient was asymptomatic 47-year-old woman. Original digitized radiograph (above) shows cluster of microcalcifications. Computer-processed image (below) shows irregularly shaped microcalcifications and triangulation lines that indicate tight cluster geometry. Leichter I, Lederman R, Buchbinder SS, Bamberger P, Novak B, Fields S, "Computerized Evaluation of Mammographic Lesions: What Diagnostic Role Does the Shape of the Individual Microcalcifications Play Compared with the Geometry of the Cluster?" (AJR, March 2004, Vol. 182, pp. 705-712).
 |
According to the results, the mean average number of neighbors per microcalcification was 3.82 in benign clusters and 4.75 in malignant clusters. The mean value of this variable in malignant clusters was 24.4% higher than that in benign clusters, the authors wrote.
"An average number of neighbors greater than 4.43 was associated with malignancies 78% of the time, and 79% of the benign cases fell below this value," they said.
The mean value of the individual microcalcification shape in malignant clusters was higher by 28% than that of benign clusters. In terms of cluster eccentricity, the mean value was 15.6% higher in the malignant group. The classification scheme performance, based on an ROC curve, was 0.87 Az. In comparison to pathology outcomes, the classification scheme came in with a specificity of 38%, a positive predictive value (PPV) of 61%, an accuracy of 68%, and a sensitivity of 98%.
"We found that for 98% sensitivity, biopsy could have theoretically been avoided in 64 cases just by computerized analysis of the number of neighbors per microcalcification in the cluster and the shape of the individual microcalcification," they concluded. "Our results indicate that the average number of neighbors has a higher impact than the shape of individual microcalcifications."
The group recommended that any classification scheme include the average number of neighbors as a parameter for cluster geometry to serve as a viable predictor of malignancy.
CAC and BI-RADS 3The BI-RADS 3 assessment is generally applied to lesions that are detected mammographically, but have a low probability of malignancy. Depending on the preference of the radiologist, these patients are referred back for imaging every six months, which can cause unnecessary stress and anxiety.
"The percentage of mammograms that are assigned to category 3 varies among radiologists from 1.4% to 14.0%," wrote Buchbinder and colleagues. "Because of the inherent ambiguity of such a classification, however, controversy has arisen about how best to manage lesions assigned to this category" (Radiology, March 2004, Vol. 230:3, pp. 820-823).
For this retrospective study, 752 cases of mammographically detected and pathologically proven masses (365 malignant, 387 benign) were culled. Of these cases, 547 underwent conventional interpretation by four different radiologists. BI-RADS 3 was assigned in 106 cases with 42 malignant lesions, and recommend for short-term interval follow-up.
For the computerized analysis, all of the mammograms were digitized at 600 dpi. The CAC system then extracted quantitative features that characterized the lesion, such as spiculation, shape, and definition of the mass margins. In addition, the CAC system was trained using 646 pathologically proven cases.
Using a jackknife analysis (described as "a method for converting the problem of estimating any population parameter into the problem of estimating a population mean"), the authors found that CAC, based on the training data results, yielded a sensitivity of 94%, a specificity of 78%, and a PPV of 81%. The area under the ROC curve was 90.
The CAC system assigned one malignant lesion to BI-RADS 2; three to BI-RADS 3, nine to BI-RADS 4, and 29 lesions to BI-RADS 5. Among benign lesions, a dozen lesions were assigned to BI-RADS 2 by the CAC system. Thirty-two lesions were called BI-RADS 3, 11 were given a BI-RADS 4 classification, and nine were deemed BI-RADS 5.
In total, the CAC system correctly upgraded the BI-RADS in 38 out of 42 malignant cases, for a sensitivity of 90%.
"The CAC system did not simply upgrade all category 3 lesions, but instead, it successfully identified almost all of the malignant lesions and thereby eliminated the delay in their diagnosis," the authors pointed out. Using a CAC system could result in a desirable "shift away from the ambiguous category 3 to other, definitive assessment categories would streamline screening mammography," they concluded.
The CAC system used in this study was from CadVision Medical Technologies of Jerusalem. Buchbinder is a stockholder in the company; Leichter, as well as co-authors Dr. Richard Lederman, Boris Novak, Ph.D., and Philippe Bamberger, Ph.D., are part-time CadVision employees.
By Shalmali PalAuntMinnie.com staff writer
March 16, 2004
Related Reading
Computer analysis does not improve mammographic detection of breast cancer, February 4, 2004
Probability calculator identifies cancers dismissed by mammographers, January 29, 2004
Foundations laid, CAD technology builds mainstream support, January 13, 2004
Computer-aided detection enhances breast MRI, June 6, 2003
Effective breast CAD still harbors a few workflow caveats, June 3, 2003
Copyright © 2004 AuntMinnie.com
![A normal mammogram confirmed by three-year radiologic follow-up illustrates reader-marked regions of interest (ROIs) during (A) unaided (round 1) and (B) artificial intelligence (AI)–assisted (round 2) reading. Each colored dot represents an ROI for recall by a human reader. Readers could mark more than one ROI per case, represented by multiple dots of the same color. During AI-assisted reading, the AI system displayed three visible prompts: two with suspicion of malignancy scores of 35% (left mediolateral oblique [L MLO] and craniocaudal [L CC]) and one with a suspicion of malignancy score of 10% (right craniocaudal [R CC]), shown as polygonal overlays. Without AI, six of 10 readers (60%) marked a false-positive ROI. With AI assistance, this fell to two of 10 (20%). R MLO = right mediolateral oblique.](https://img.auntminnie.com/mindful/smg/workspaces/default/uploads/2026/07/2026-07-14-radiology-mammogram-ai-auto-bias.H0bYO8QlWs.jpg?auto=format%2Ccompress&fit=crop&h=100&q=70&w=100)


![A normal mammogram confirmed by three-year radiologic follow-up illustrates reader-marked regions of interest (ROIs) during (A) unaided (round 1) and (B) artificial intelligence (AI)–assisted (round 2) reading. Each colored dot represents an ROI for recall by a human reader. Readers could mark more than one ROI per case, represented by multiple dots of the same color. During AI-assisted reading, the AI system displayed three visible prompts: two with suspicion of malignancy scores of 35% (left mediolateral oblique [L MLO] and craniocaudal [L CC]) and one with a suspicion of malignancy score of 10% (right craniocaudal [R CC]), shown as polygonal overlays. Without AI, six of 10 readers (60%) marked a false-positive ROI. With AI assistance, this fell to two of 10 (20%). R MLO = right mediolateral oblique.](https://img.auntminnie.com/mindful/smg/workspaces/default/uploads/2026/07/2026-07-14-radiology-mammogram-ai-auto-bias.H0bYO8QlWs.jpg?auto=format%2Ccompress&dpr=2&fit=crop&h=167&q=70&w=250)


