Cardiac MRI exams played a part in the U.S. Food and Drug Administration's (FDA's) new requirements issued on COVID-19 vaccines and heart inflammation risk.
In a letter published June 25, the FDA said it now requires companies to include new safety information about the risks of myocarditis and pericarditis following the administration of mRNA COVID-19 vaccines.
Vaccine manufacturers must now update the warning about the risks of myocarditis and pericarditis to include information about the estimated unadjusted incidence of myocarditis and/or pericarditis following administration of the 2023-2024 formula of mRNA COVID-19 vaccines. They must also post results of a study that included cardiac MRI data from people who developed myocarditis after receiving an mRNA COVID-19 vaccine.
The agency cited a study published in September 2024, which found that cardiac MRI showed heart muscle changes between patients developing myocarditis and having a follow-up five months later.
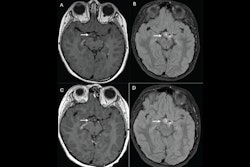
Study authors reported that large gadolinium enhancement on cardiac MRI was more prevalent in patients with COVID-19 vaccine-associated myocarditis (82% vs. 16% for controls, p < 0.001). And 41% percent of patients who underwent cardiac MRI showed evidence of myocardial edema based on T2-weighted imaging or T2 mapping.
"The initial and follow-up cardiac MRIs commonly showed signs of injury to the heart muscle, with improvement over time in some but not all people," the FDA said. "It is not known if these cardiac MRI findings might predict long-term heart effects of myocarditis."
The administration added that manufacturers are now also required to study whether there are long-term heart effects in people who have had myocarditis after receiving an mRNA COVID-19 vaccine.
Studies involving vaccines manufactured by Pfizer and ModernaTX are underway, the FDA said. The companies make the Comirnaty and Spikevax vaccines, respectively.


![Overview of the study design. (A) The fully automated deep learning framework was developed to estimate body composition (BC) (defined as subcutaneous adipose tissue [SAT] in liters; visceral adipose tissue [VAT] in liters; skeletal muscle [SM] in liters; SM fat fraction [SMFF] as a percentage; and intramuscular adipose tissue [IMAT] in deciliters) from MRI. The fully automated framework comprised one model (model 1) to quantify different BC measures (SAT, VAT, SM, SMFF, and IMAT) as three-dimensional (3D) measures from whole-body MRI scans. The second model (model 2) was trained to identify standardized anatomic landmarks along the craniocaudal body axis (z coordinate field), which allowed for subdividing the whole-body measures into different subregions typically examined on clinical routine MRI scans (chest, abdomen, and pelvis). (B) BC was quantified from whole-body MRI in over 66,000 individuals from two large population-based cohort studies, the UK Biobank (UKB) (36,317 individuals) and the German National Cohort (NAKO) (30,291 individuals). Bar graphs show age distribution by sex and cohort. BMI = body mass index. (C) After the performance assessment of the fully automated framework, the change in BC measures, distributions, and profiles across age decades were investigated. Age-, sex-, and height-adjusted body composition reference curves were calculated and made publicly available in a web-based z-score calculator (https://circ-ml.github.io).](https://img.auntminnie.com/mindful/smg/workspaces/default/uploads/2026/05/body-comp.XgAjTfPj1W.jpg?auto=format%2Ccompress&fit=crop&h=100&q=70&w=100)


![Overview of the study design. (A) The fully automated deep learning framework was developed to estimate body composition (BC) (defined as subcutaneous adipose tissue [SAT] in liters; visceral adipose tissue [VAT] in liters; skeletal muscle [SM] in liters; SM fat fraction [SMFF] as a percentage; and intramuscular adipose tissue [IMAT] in deciliters) from MRI. The fully automated framework comprised one model (model 1) to quantify different BC measures (SAT, VAT, SM, SMFF, and IMAT) as three-dimensional (3D) measures from whole-body MRI scans. The second model (model 2) was trained to identify standardized anatomic landmarks along the craniocaudal body axis (z coordinate field), which allowed for subdividing the whole-body measures into different subregions typically examined on clinical routine MRI scans (chest, abdomen, and pelvis). (B) BC was quantified from whole-body MRI in over 66,000 individuals from two large population-based cohort studies, the UK Biobank (UKB) (36,317 individuals) and the German National Cohort (NAKO) (30,291 individuals). Bar graphs show age distribution by sex and cohort. BMI = body mass index. (C) After the performance assessment of the fully automated framework, the change in BC measures, distributions, and profiles across age decades were investigated. Age-, sex-, and height-adjusted body composition reference curves were calculated and made publicly available in a web-based z-score calculator (https://circ-ml.github.io).](https://img.auntminnie.com/mindful/smg/workspaces/default/uploads/2026/05/body-comp.XgAjTfPj1W.jpg?auto=format%2Ccompress&fit=crop&h=112&q=70&w=112)


