Childhood neglect negatively alters the brain's white matter, leaving concealed but lasting marks on children's emotional, cognitive, and behavioral development, researchers have reported.
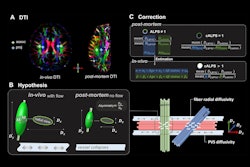
Diffusion-tensor MRI (DTI-MRI) shows the effects of this kind of abuse on the brain, identifying structural abnormalities in regions linked to emotion, behavior, and cognition, according to a team led by Natasha Kawata, MD, of the University of Fukui in Japan. The group's results were published in Scientific Reports.
"Our findings demonstrate that even in the absence of physical or emotional abuse, neglect alone can have a profound impact on brain development," said corresponding author Akemi Tomoda, MD, PhD, in a statement issued August 22 by the university.
Child abuse is often understood as violence or emotional cruelty, the authors explained. But neglect -- that is, failing to provide adequate food, shelter, supervision, or protection during a child's early years -- is the most common but least obvious form of child abuse, affecting three out of four children around the world, they noted.
The effect of childhood neglect on a child's developing brain has been unclear, according to Kawata and colleagues. To fill the knowledge gap, the team conducted a study that compared the white-matter microstructure of neglected children (without other types of maltreatment) to that of "typically developing" children, using DTI-MRI, an imaging technique that identifies subtle abnormalities in a person's neural communication pathways.
The study included 21 children considered neglected and 106 "typically developing" children. The investigators reported that neglected children had significant deficits in three important brain regions:
- The right corticospinal tract, which controls voluntary movement and motor skills
- The right superior longitudinal fasciculus, which plays an important role in attention, language, and executive functions
- The left cingulum, which connects emotional and cognitive brain systems and manages emotional regulation
These brain abnormalities were directly linked to conduct and behavioral difficulties, the group wrote.
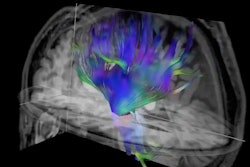
 Larger white-matter fiber tracts were observed in the neglected group compared with the typically developing group. Slices of the mean fractional anisotropy skeleton (green), overlaid with red clusters, depict significantly higher axial diffusivity values in the neglected group than in the typically developing group. Image courtesy of Akemi Tomoda, MD, PhD, from the University of Fukui, Japan, and used according to Creative Commons License CC BY NC ND 4.0.
The study results could help "reshape child protection policies and inform training programs for professionals," according to the university statement. "By understanding the interplay between neglect and its effect on behavior and the brain, it will be possible to design targeted interventions and therapies that can directly address the specific developmental challenges faced by affected children."
"In the future, the newfound brain-based indicators may be used to monitor neurodevelopment and evaluate the effectiveness of interventions, contributing to the establishment of new support models for neglected children," Tomoda concluded.
The complete study can be found here.