Proton MR spectroscopy (MRS) reveals "remarkable" neurochemical patterns associated with COVID-19-induced anosmia, or loss of smell, according to a study published January 22 in Academic Radiology.
The idea that COVID-19 has long-ranging effects on the central nervous system "could serve as a valuable guide for future research aimed at diagnosing and treating persistent COVID-19-induced anosmia," noted a team led by Mohammad Haghani Dogahe, MD, of Ghaem International Hospital in Rasht, Iran.
"[Our] study highlights remarkable neurochemical patterns associated with COVID-19-induced anosmia in brain orbitofrontal cortex detectable by proton MRS, shedding light on the link between orbitofrontal cortex function impairment and anosmia," the group wrote.
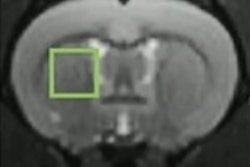
Many individuals with COVID-19-induced anosmia recover their sense of smell within a few months, the investigators explained. But a significant number continue to experience olfactory impairment. Dogahe and colleagues conducted a study that used MRS to assess metabolic patterns in patients' orbitofrontal cortex, seeking to identify any alterations within this brain region in those with the condition. (Proton MRS is an MR imaging method that characterizes a tissue's metabolic activity and biochemical composition by analyzing signals from hydrogen nuclei.)
Their research included 54 subjects categorized into two groups, each with 27 patients: one cohort with COVID-19-related anosmia and another cohort of patients who had COVID-19 but did not experience anosmia. The team used a tool called the Iran Recognition-Smell Identification Test (IR-SIT) over a three-month follow-up period to assess study participants' olfactory function and diagnose anosmia; all patients underwent proton MRS to identify changes of metabolites in the orbitofrontal cortex, including N-acetyl aspartate (NAA), choline (Cho), and creatine (Cr). It also investigated any correlation between the MRS data and the IR-SIT scores.
The team found the following:
- Patients with COVID-19-induced anosmia showed a significant reduction in NAA, Cho, and Cr levels in the orbitofrontal cortex compared to the control group.
- Anosmia patients showed lower NAA/Cho and NAA/Cr ratios, but elevated Cho/Cr ratios.
- The NAA/Cho ratio had the highest correlation with IR-SIT scores in patients with anosmia.
This last finding was of particular interest, according to the authors.
"The NAA/Cho ratio derived from MRS data emerged as a potential biomarker that correlates with anosmia severity and recovery examination," they noted.
| Comparison of metabolite intensities and metabolic ratios in the orbitofrontal cortex between subjects without COVID-19-induced anosmia and those with the condition | ||
|---|---|---|
| Metabolite | Those without COVID-19-induced anosmia | Those with COVID-19-induced anosmia |
| N-acetyl aspartate (NAA) | 301.73 | 147.59 |
| Choline (Cho) | 67.49 | 51.77 |
| Creatine (Cr) | 185.47 | 106.31 |
| NAA/Cho | 4.47 | 2.89 |
| NAA/Cr | 1.62 | 1.38 |
| Cho/Cr | 0.36 | 0.49 |
| *All results statistically significant | ||
The study results show promise, but more research is needed, according to the investigators.
"While MRS reveals distinct neurochemical patterns between OFC dysfunction and anosmia, further investigation can assist to better understand the relationship between central nervous system abnormalities and olfactory impairment in COVID-19 patients," they concluded.
The complete study can be found here.