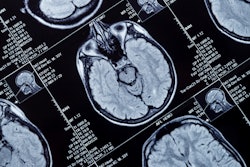
MRI shows that women who have their ovaries removed before menopause have reduced white matter integrity in multiple regions of the brain later in life, according to research published June 20 in Alzheimer’s & Dementia.
A team led by Michelle Mielke, PhD, from Wake Forest University in Winston-Salem, NC, found that this trend especially goes for women who have premenopausal bilateral oophorectomy (PBO) before the age of 40.
“These results are important for [women] considering PBO for noncancerous conditions,” Mielke and colleagues wrote.
Previous research demonstrates that having both ovaries removed before natural menopause can cause sudden endocrine dysfunction, which in turn raises the risk of cognitive impairment and dementia. However, the researchers pointed out that few neuroimaging studies have been performed with the aim of better understanding underlying factors.
Mielke et al studied the impact of PBO overall and PBO on the intensity of white matter, the nerve fibers that connect neurons in different areas of the brain. The researchers used MRI diffusion tensor imaging (DTI), which generates images from the diffusion of water molecules to generate contrast in images. They obtained MR brain images on a 3-tesla scanner with an eight-channel phase array coil between 2011 and 2020 and acquired DTI scans using a single-shot echo-planar imaging sequence with an isotropic resolution of 2.7 mm.
The study included data from 1,011 women. Of the total, 22 had PBO before age 40, 43 had PBO between the ages of 40 and 45, 39 had PBO between the ages of 46 and 49; 907 women who did not undergo PBO at all served as a reference cohort.
The researchers found that women who underwent PBO before age 40 had significantly lower fractional anisotropy compared with other women in the study in the following brain areas: anterior corona radiata (b = −0.39, p = 0.02); genu of the corpus callosum (b = −0.37, p = 0.05); inferior fronto-occipital fasciculus (b = −0.60, p = 0.005); inferior frontal white matter (b = −0.48, p = 0.007); superior occipital (b = −0.41, p = 0.04); and superior temporal white matter (b = −0.48, p = 0.02).
The team also reported no differences in fractional anisotropy or mean diffusivity white matter integrity for women who had the procedure between the ages of 40 and 44 compared with the reference cohort.
However, women who underwent PBO between the ages of 45 and 49 had lower frontal anisotropy in the following white matter regions compared to the reference group: interior occipital (b = −0.43, p = 0.006); middle frontal (b = −0.35, p = 0.02); posterior thalamic radiation (b = −0.31, p = 0.04); supramarginal (b = −0.33, p = 0.03); and superior occipital (b = −0.31, p = 0.04).
Similarly, women who underwent PBO between the ages of 45 and 49 had higher mean diffusivity in the middle frontal (b = 0.28, p = 0.045), retro-lenticular part of the internal capsule (b = 0.35, p = 0.02), superior occipital (b = 0.41, p = 0.007), and superior temporal (b = 0.29, p = 0.047) white matter regions.
Finally, more than 80% of women who underwent PBO at all ages used estrogen replacement therapy (ERT). However, adjusting for ERT use did not alter the findings, the authors wrote.
Mielke and colleagues called for future studies with larger sample sizes to validate their results.
“In addition, [women] in this study used conjugated equine estrogens and it is not known whether other forms of ERT would be more beneficial in maintaining later-life brain white matter integrity,” they noted.
The full results can be found here.