
Fujifilm Europe said it will unveil a number of new products at the upcoming 2023 European Congress of Radiology (ECR) meeting to be held March 1-5 in Vienna.
The following are among the company's latest additions that will be showcased at its booth (502 | EXPO 5):
- ARIETTA 750 DeepInsight ultrasound system. The system features views of tissue structures in a number of clinical applications using artificial intelligence-based technology.
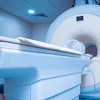
- ECHELON Synergy MRI scanner. The scanner combines architecture and deep-learning reconstruction with single-touch shortcuts and multiple on-gantry controls.
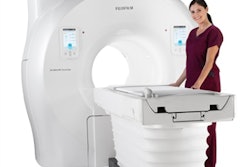
- SCENARIA View Focus Edition CT scanner. The scanner features advanced cardiac motion correction. The scanner's SynergyDrive is designed to accelerate workflows, and it includes a new operator console that uses the same interface as Synapse 3D.
- FDR Cross C-arm and smart fluoroscopy cart. This hybrid mobile C-arm provides clinicians with fluoroscopic and radiographic image capture in a single platform while also allowing flexible positioning for imaging, similar to portable x-ray devices.
- FDR D-EVO III G80i digital x-ray detector for scoliosis, spine, and orthopedic procedures. The lightweight, wireless, long-length DR detector is combined with low-dose technologies, antibacterial coating, and single-exposure capture.
- Comfort Comp feature for mammography, a feature designed to control compression while monitoring force and thickness, which may provide a more comfortable breast imaging experience for patients.
In addition, visitors to Fujifilm's booth will get a view of how hospitals of the future could look, the company said. Created by internationally recognized architect Filippo Taidelli, the booth's design uses natural phenomena, such as reflections and lights, to provide a glimpse of the possible future of healthcare settings, Fujifilm said.


![Overview of the study design. (A) The fully automated deep learning framework was developed to estimate body composition (BC) (defined as subcutaneous adipose tissue [SAT] in liters; visceral adipose tissue [VAT] in liters; skeletal muscle [SM] in liters; SM fat fraction [SMFF] as a percentage; and intramuscular adipose tissue [IMAT] in deciliters) from MRI. The fully automated framework comprised one model (model 1) to quantify different BC measures (SAT, VAT, SM, SMFF, and IMAT) as three-dimensional (3D) measures from whole-body MRI scans. The second model (model 2) was trained to identify standardized anatomic landmarks along the craniocaudal body axis (z coordinate field), which allowed for subdividing the whole-body measures into different subregions typically examined on clinical routine MRI scans (chest, abdomen, and pelvis). (B) BC was quantified from whole-body MRI in over 66,000 individuals from two large population-based cohort studies, the UK Biobank (UKB) (36,317 individuals) and the German National Cohort (NAKO) (30,291 individuals). Bar graphs show age distribution by sex and cohort. BMI = body mass index. (C) After the performance assessment of the fully automated framework, the change in BC measures, distributions, and profiles across age decades were investigated. Age-, sex-, and height-adjusted body composition reference curves were calculated and made publicly available in a web-based z-score calculator (https://circ-ml.github.io).](https://img.auntminnie.com/mindful/smg/workspaces/default/uploads/2026/05/body-comp.XgAjTfPj1W.jpg?auto=format%2Ccompress&fit=crop&h=100&q=70&w=100)


![Overview of the study design. (A) The fully automated deep learning framework was developed to estimate body composition (BC) (defined as subcutaneous adipose tissue [SAT] in liters; visceral adipose tissue [VAT] in liters; skeletal muscle [SM] in liters; SM fat fraction [SMFF] as a percentage; and intramuscular adipose tissue [IMAT] in deciliters) from MRI. The fully automated framework comprised one model (model 1) to quantify different BC measures (SAT, VAT, SM, SMFF, and IMAT) as three-dimensional (3D) measures from whole-body MRI scans. The second model (model 2) was trained to identify standardized anatomic landmarks along the craniocaudal body axis (z coordinate field), which allowed for subdividing the whole-body measures into different subregions typically examined on clinical routine MRI scans (chest, abdomen, and pelvis). (B) BC was quantified from whole-body MRI in over 66,000 individuals from two large population-based cohort studies, the UK Biobank (UKB) (36,317 individuals) and the German National Cohort (NAKO) (30,291 individuals). Bar graphs show age distribution by sex and cohort. BMI = body mass index. (C) After the performance assessment of the fully automated framework, the change in BC measures, distributions, and profiles across age decades were investigated. Age-, sex-, and height-adjusted body composition reference curves were calculated and made publicly available in a web-based z-score calculator (https://circ-ml.github.io).](https://img.auntminnie.com/mindful/smg/workspaces/default/uploads/2026/05/body-comp.XgAjTfPj1W.jpg?auto=format%2Ccompress&fit=crop&h=112&q=70&w=112)


