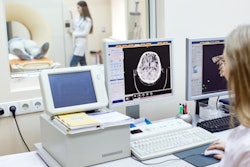
Our Road to RSNA preview for the RSNA 2018 meeting in Chicago continues today with MRI. One enduring attribute about MRI is that no matter how long the modality has been around, it is always in a constant state of evolution.
For example, artificial intelligence (AI) looks to have some of its greatest impact in MRI. Researchers are training AI algorithms to analyze and interpret MRI data to help radiologists do their jobs, such as in complicated cardiac MRI scans, noninvasively dissecting causes of epilepsy, determining the best course of treatment for cancer patients, and improving image quality for noncontrast coronary MR angiography.
As one would expect, the issue of gadolinium-based contrast agents (GBCAs) in MRI remains a hot-button issue for radiologists, clinicians, and researchers alike. Even with the escalating amount of research into gadolinium deposition, more questions than answers still remain about how traces of the element travel to and accumulate in brain tissue, bone, skin, and the liver. Is gadolinium's route through microbleeds in the blood-brain barrier? Or does it infiltrate into cerebrospinal fluid? Is gadolinium deposition more widespread than currently thought? And are linear GBCAs more prone to deposition than macrocyclic agents?
Without a consensus -- and perhaps even after more definitive information is achieved -- researchers will continue to explore viable alternatives to GBCAs for MRI contrast. One promising option appears to be ferumoxytol. Several scientific paper presentations at RSNA 2018 will detail how the MRI contrast agent could benefit a wide range of patients and aid in such endeavors as detecting cancer in the joints of pediatric patients. For example, one study scheduled for Chicago will allay concerns that ferumoxytol can adversely affect results from the FDG-PET portion of simultaneous PET/MRI scans.
Speaking of PET/MRI, the hybrid modality is almost a decade old. Clinicians are increasingly comfortable and adept at using PET/MRI, and the number of clinical applications for which it is utilized has increased. Several researchers will show how they are expanding the role of PET/MRI in their practices and finding ways to reduce scan time for anxious patients.
Since the theme of RSNA 2018 is "Tomorrow's radiology today," what might be the future for 7-tesla MRI? Within the last 13 months, two U.S. hospitals have begun using 7-tesla scanners for clinical use. In time, we will know how ultrahigh-field MRI can contribute more regularly to the diagnoses of neurological conditions, such as dementia and Alzheimer's disease, epilepsy, and autism.
Here we have highlighted a small sample of MRI presentations scheduled for RSNA 2018. Certainly, there are multitudes of worthwhile scientific sessions, posters, refresher courses, and educational exhibits throughout the conference to advance your knowledge and use of the modality. For more information on all the presentations, as well as their times and locations, view the RSNA 2018 meeting program.