
The notorious Zika virus has an appearance on MRI scans that can be associated with meningoencephalitis, according to a research letter by a French group that was published March 9 in the New England Journal of Medicine.
The group describes the case of an 81-year-old man who was admitted to the intensive care unit 10 days after returning from a four-week cruise through New Caledonia, Vanuatu, the Solomon Islands, and New Zealand, during which he was reported to be in perfect health. The man had a fever of 102.4° F (39.1° C) and was comatose; other symptoms included hemiplegia of the left side and paresis of the right upper limb.
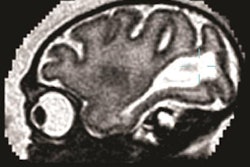
An MRI scan of the brain suggested meningoencephalitis, with "asymmetric white-matter hyperintensities on fluid-attenuated inversion recovery (FLAIR) imaging, multiple punctuated hyperintensities on diffusion-weighted sequences that were evocative of ischemic foci, and a slight hyperintensity of the right Rolandic fissure that was evocative of meningitis." CT also showed an irregular narrowing of the right callosomarginal artery.
Further tests suggested meningitis, but tests of the patient's blood and cerebrospinal fluid were not revealing. Ultimately, the Zika virus was grown in a culture from the patient's cerebrospinal fluid on a cell line.
The patient's condition continued to improve during his hospitalization, and he was discharged from the intensive care unit on day 17. His cognitive function was fully recovered by day 38.
The authors cautioned clinicians that the presentation of the Zika virus may be associated with meningoencephalitis.


![Overview of the study design. (A) The fully automated deep learning framework was developed to estimate body composition (BC) (defined as subcutaneous adipose tissue [SAT] in liters; visceral adipose tissue [VAT] in liters; skeletal muscle [SM] in liters; SM fat fraction [SMFF] as a percentage; and intramuscular adipose tissue [IMAT] in deciliters) from MRI. The fully automated framework comprised one model (model 1) to quantify different BC measures (SAT, VAT, SM, SMFF, and IMAT) as three-dimensional (3D) measures from whole-body MRI scans. The second model (model 2) was trained to identify standardized anatomic landmarks along the craniocaudal body axis (z coordinate field), which allowed for subdividing the whole-body measures into different subregions typically examined on clinical routine MRI scans (chest, abdomen, and pelvis). (B) BC was quantified from whole-body MRI in over 66,000 individuals from two large population-based cohort studies, the UK Biobank (UKB) (36,317 individuals) and the German National Cohort (NAKO) (30,291 individuals). Bar graphs show age distribution by sex and cohort. BMI = body mass index. (C) After the performance assessment of the fully automated framework, the change in BC measures, distributions, and profiles across age decades were investigated. Age-, sex-, and height-adjusted body composition reference curves were calculated and made publicly available in a web-based z-score calculator (https://circ-ml.github.io).](https://img.auntminnie.com/mindful/smg/workspaces/default/uploads/2026/05/body-comp.XgAjTfPj1W.jpg?auto=format%2Ccompress&fit=crop&h=100&q=70&w=100)


![Overview of the study design. (A) The fully automated deep learning framework was developed to estimate body composition (BC) (defined as subcutaneous adipose tissue [SAT] in liters; visceral adipose tissue [VAT] in liters; skeletal muscle [SM] in liters; SM fat fraction [SMFF] as a percentage; and intramuscular adipose tissue [IMAT] in deciliters) from MRI. The fully automated framework comprised one model (model 1) to quantify different BC measures (SAT, VAT, SM, SMFF, and IMAT) as three-dimensional (3D) measures from whole-body MRI scans. The second model (model 2) was trained to identify standardized anatomic landmarks along the craniocaudal body axis (z coordinate field), which allowed for subdividing the whole-body measures into different subregions typically examined on clinical routine MRI scans (chest, abdomen, and pelvis). (B) BC was quantified from whole-body MRI in over 66,000 individuals from two large population-based cohort studies, the UK Biobank (UKB) (36,317 individuals) and the German National Cohort (NAKO) (30,291 individuals). Bar graphs show age distribution by sex and cohort. BMI = body mass index. (C) After the performance assessment of the fully automated framework, the change in BC measures, distributions, and profiles across age decades were investigated. Age-, sex-, and height-adjusted body composition reference curves were calculated and made publicly available in a web-based z-score calculator (https://circ-ml.github.io).](https://img.auntminnie.com/mindful/smg/workspaces/default/uploads/2026/05/body-comp.XgAjTfPj1W.jpg?auto=format%2Ccompress&fit=crop&h=112&q=70&w=112)


