Jet lag is the bane of long-distance travelers. Global types are all too familiar with the insomnia and headaches that can accompany flights over numerous time zones. In the June issue of Nature Neuroscience, however, researchers said jet lag is more than just an inconvenience.
According to a study by Kwangwook Cho, Ph.D., and colleagues at the University of Bristol in the U.K., frequent exposure to jet lag can cause a reduction of the right temporal lobe volume, higher cortisol levels, and impaired cognitive performance.
Cho theorized that high cortisol levels could lead to atrophy of the hippocampus, which is related to short-term memory dysfunction, and sometimes amnesia. Within the context of the study, however, Cho aimed "to test the hypothesis that exposure to chronic disruption of circadian rhythms [could] cause cognitive decrements in humans" (Nature Neuroscience, June 2001, Vol.4:6, pp.567-568).
Twenty airline attendants divided into two groups with differing recovery periods were repeatedly subjected to jet lag over five years. The subjects underwent imaging on a 1.5-tesla Signa Horizon scanner (GE Medical Systems, Waukesha, WI). Sagittal T1-weighted images (TR 350 ms; TE 10 ms; slice thickness 5 mm; interslice gap 0 mm) were acquired. The images were then reformatted into 5-mm slices in the coronal plane for the volumetric calculation.
 |
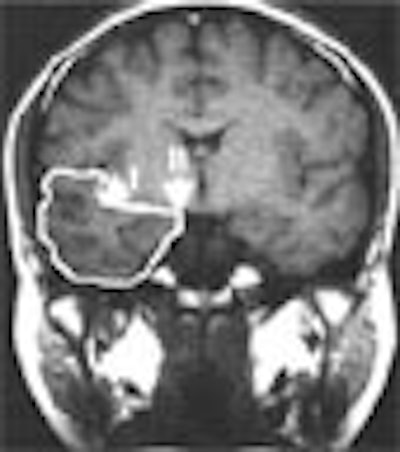
coronal MR images. Volumetric analysis was averaged for each
series of slices per subject. Image courtesy of Nature
Neuroscience.
Using four coronal MRI slices selected between the precentral and postcentral gyri, Cho found evidence that those who had less than five days of recovery time between international flights had smaller right temporal lobe volumes than attendants who had more than 14 days of recovery time, the study stated.
Cho linked the reduction in temporal lobe structures to higher cortisol levels. He noted that the attendants with the shorter recovery intervals had higher cortisol levels than the long-recovery group. Additionally, he associated higher cortisol levels to cognitive deficits, saying that the group with the shorter recovery period did not perform as well on visual spatial cognitive tests.
Cho offered a solution that he said could reverse the atrophy process connected to chronic jet lag exposure.
"Jet lag recovery period may be a potential way to eliminate the temporal lobe atrophy associated with repeated jet lag," he wrote. "This needs further study, however. If temporal lobe atrophy is caused by neurotoxicity (i.e., long-term exposure to high cortisol levels), then it would be difficult to determine whether frequent fliers will recover or not. If it is caused by simple physical change (i.e., pressure or altitude change), it may be possible to determine" if recovery is possible.
The next stage of research will seek to determine whether temporal lobe atrophy has lasting cognitive effects.
"This study is moving onto whether the atrophy results in temporary or permanent deficits. Circadian disruption induces a lot of stress, so we are also monitoring the stress levels of the study groups to determine whether it affects temporal lobe atrophy or not," he wrote.
By Jennifer LungAuntMinnie.com staff writer
June 21, 2001
Click here to post your comments about this story. Please include the headline of the article in your message.
Copyright © 2001 AuntMinnie.com