Scientists from the U.S. National Institute of Standards and Technology (NIST) have developed a method for standardizing the measurement of x-rays emitted by different CT scanners. They describe the method in an article recently published in PLOS One.
CT scanners have distinct settings that make precise comparisons of data from scanners of different manufacturers extremely challenging, first author Zachary Levine, PhD, said in a statement.
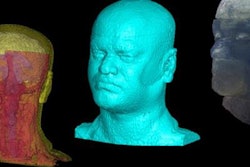
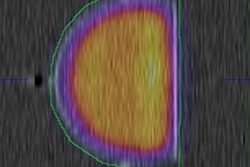
To help overcome the uncertainty associated with variation among CT scanners, Levine and colleagues filled several CT phantoms with differing concentrations of chemicals commonly found in the human body and then compared the radiodensity of these phantoms using CT.
They subsequently used a linear algebra technique to identify two dimensions that effectively characterized the radiodensity of the phantoms based on the volume of the moles of each chemical (PLOS One, December 20, 2018).
This characterization opened up the possibility of linking Hounsfield units (HU), the unit most commonly used to describe the radiodensity of objects on CT scans, to moles per cubic meter, part of the International System of Units -- creating a more precise definition of the units used for CT, Levine noted.
"Basically, we've shown that you can create a CT scanner performance target that any design engineer can hit," he said. "Manufacturers have been getting different answers in their machines for decades because no one told their engineers how to handle the x-ray spectrum. Only a small change to existing practice is required to unify their measurements."