Researchers from the U.K. have developed a method that uses a combination of CT scans and computational mathematics to determine lung function and distinguish between different stages of lung disease, according to an article published online May 10 in Scientific Reports.
The team of mathematicians, clinicians, and image specialists from the University of Southampton acquired the CT scans of 64 people categorized as healthy nonsmokers, healthy smokers, patients with moderate chronic obstructive pulmonary disease (COPD), or patients with mild COPD. Next, they used topology to numerically describe the 3D structure of the lungs on these CT scans.
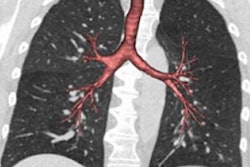
 Illustration of lung structure based on the topology of CT scans. Image courtesy of the University of Southampton.
After analyzing the structure, size, length, and direction of the bronchial tree and its branches, as well as any changes to their shape during inhalation and exhalation, the researchers discovered that the larger and more complex a tree was, the better its function appeared to be. Furthermore, they were able to identify which patients had COPD and the stage of their disease using the technique.
The researchers hope that applying this analytical tool to a larger database of medical images might ultimately lead to its use in clinical practice for diagnosing lung conditions such as COPD and asthma.