The availability of more detector rows on multidetector CT scanners has speeded up kidney scans along with everything else. But it has also made contrast timing all the more critical, and spurred the routine use of bolus-tracking programs.
Once the contrast material is injected, the programs can be set to measure changes in CT attenuation -- at the level of the upper abdominal aorta, for example -- providing a benchmark from which to time multiphasic scans based on the individual patient's cardiac output.
Additional scan delays are required for the various phases after the abdominal aorta is opacified, however, which is what researchers were aiming to optimize in a study presented at the 2004 RSNA meeting in Chicago.
"The purpose of our study was to determine optimal scan delay required for renal arterial cortomedullary, nephrographic, and renal venous phases of contrast MDCT of the kidneys, using the bolus-tracking program," said Dr. Hironori Nishibori, a radiologist from the Gifu University School of Medicine in Gifu, Japan.
Twelve of 140 consecutive patients were excluded for atrophy, hydronephrosis, or multiple renal cysts, leaving 128 patients in the study cohort randomized into three groups. All were scanned following administration of nonionic iodinated IV contrast (300 mgI/mL at 4 mL/sec., 2 mL/kg for 120 patients weighing 38-75 kg, and 150 mL fixed for 8 patients weighing more than 75 kg), Nishibori said.
CT images were acquired on an eight-detector scanner (Aquilion, Toshiba Medical Systems, Tokyo, Japan) using 2.5-mm collimation and 5-mm reconstruction thicknesses.
Once the patients were randomized into three groups in order to evaluate three sets of scan delays, scanning began at 5, 20 and 45 seconds, 10, 25 and 50 seconds, and 15, 30, and 55 seconds, respectively, after the bolus-tracking program detected an increase of 50 HU in the upper abdominal aorta.
The researchers measured CT attenuation in the renal arteries, cortex, medulla, veins, and pelvis. The increase in CT values pre-to-post contrast was also measured, along with renal-artery-to-vein and renal-cortex-to-medulla contrast.
"The degrees of enhancement were expressed as contrast enhancement indices, or CEI, which were calculated by subtracting the CT values in unenhanced images from those of enhanced images," Nishibori said. Finally, two radiologists working independently assessed contrast enhancement in each organ qualitatively on a four-point scale.
There were 48, 44, and 35 patients in groups 1, 2, and 3, respectively, and there were no significant differences in patient age, body weight, or overall aortic transit time between the three patient groups. Quantitative results correlated well with the qualitative results, Nishibori said.
The mean CEI of the abdominal aorta was high from 5-15 seconds, "peaked at 10 seconds (288 ∆ HU), and reduced with time," he said. Renal arterial enhancement, expressed in mean CEI, was high (240-288 ∆ HU) from 5-15 seconds, peaked at 10 seconds (288 ∆ HU), gradually reduced from 10 to 45 seconds, and plateaued at 45-55 seconds, Nishibori said.
The mean CEI of the renal cortex was high from 10-30 seconds (195-217 ∆ HU), "increased constantly from 5 to 25 seconds, peaked at 20-25 seconds (213-217 ∆ HU), and then gradually reduced," he said. The mean CEI of the renal vein peaked (168 ∆ HU) at 10 seconds. "The mean CEI of the renal aorta increased constantly from 5 to 55 seconds, and peaked at 55 seconds."
 |
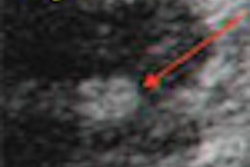
| Above, 5-second delay (renal arterial phase) 73-year-old female patient. All images courtesy of Dr. Hironori Nishibori and Dr. Masa Kanematsu. |
 |
| Above, 10-second delay (corticomedullary phase) seen in 46-year-old male patient. |
 |
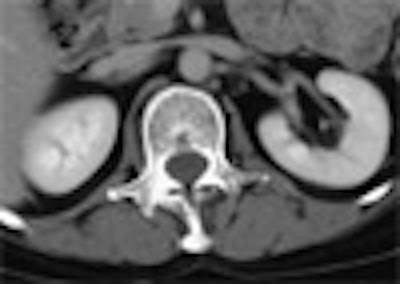
| Above, 55-second delay (nephrographic phase) seen in 51-year-old female patient. |
Renal cortex-to-medulla enhancement was high (110-140 ∆ HU) at 5-30 seconds, peaked at 10-15 seconds, and fell below 30 HU at 45 seconds. Renal artery-to-vein contrast was high (121-125 ∆ HU) at 5-10 seconds.
"In our study, aortic transit time widely varied from 6 to 33 seconds, which reflected the difference in cardiac output of the patients," he said. "The bolus-tracking program was useful to compensate for the dispersion of the optimal delay times in individual patients."
Once the bolus-tracking program detects threshold enhancement of 50 HU in the upper abdominal aorta, the protocol provided optimal scan delay at 5 seconds for renal artery CT angiography, 10-30 seconds for the corticomedullary phase, and 55 seconds for the nephrographic phase, Nishibori concluded.
By Eric BarnesAuntMinnie.com staff writer
February 21, 2004
Related Reading
Detecting analgesic nephropathy a pain on CT, January 5, 2005
Renal mass with nonrenal malignancy may not need biopsy, December 2, 2004
US, MRI challenge CT for classifying renal cell carcinoma, June 17, 2003
Imaging explores link between kidney failure and atherosclerosis, January 28, 2002
Copyright © 2005 AuntMinnie.com