As CT and MRI vie for supremacy in stroke assessment, perfusion CT (PCT) is earning points for its ability to clearly delineate both infarct and penumbra. Radiologists who perform the functional CT test are gaining confidence in their methods -- and are using them increasingly to predict which patients are likely to benefit from thrombolytic therapy.
In presentations at the 2003 RSNA meeting earlier this month, researchers found that PCT can help predict outcomes and monitor treatment response.
Time is perhaps the most critical factor in evaluating acute stroke patients, but that doesn't mean radiologists should rush into thrombolytic therapy without the benefit of perfusion CT (PCT), say researchers from Lausanne, Switzerland. The group believes that PCT and CT angiography (CTA) are complementary tests that can help predict which patients will benefit from therapy and which will only increase their risk of bleeding.
Another study, from Münster, Germany, concluded that PCT offers prognostic value for neurological improvement in stroke patients, and can effectively monitor the progress of tissue reperfusion therapy.
Predicting therapeutic benefit
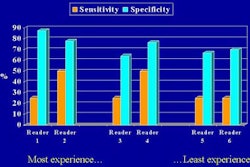
"Even when performed within the first three hours of the onset of the symptomatology, intravenous thrombolysis (rTPA) is associated with a significant risk of intracerebral hemorrhage, at least when ... done with non-contrast CT," said Dr. Max Wintermark from University Hospital in Lausanne. "The problem with non-contrast CT is that its sensitivity within the first three hours is limited, less than 50%, and sometimes even lower depending on the study. The intraobserver agreement is also relatively low, and even when the images are specially processed ... 11% of the patients are inappropriately included in the (thrombolysis) protocol."
Perfusion CT uses contrast material to extract information about cerebral blood flow, including mean transit time (MTT) of the contrast bolus through the capillary network, regional cerebral blood volume (rCBV) and regional cerebral blood flow, which measure blood volume and flow, respectively, in terms of CT image pixels.
"By combining the interpretation of the blood flow and the blood-volume maps you can extract some prognostic maps showing the infarct in red and the penumbra in green," he said. "You can follow the perfusion CT with CTA, and you can assess most extracranial and intracranial cerebral arteries."
The study sought to determine whether CT and CTA are critical factors before intravenous thrombolysis, and whether performing them both delays treatment significantly. The second goal was to look for prognostic factors that determined the success of thrombolysis, he said.
In the study, PCT was used to assess viable ischemic tissue and infarct upon admission by measuring the penumbra volume/penumbra plus infarct volume ratio (Lausanne Stroke Index, LSI). Thresholds were applied to the CT values to distinguish infarct from penumbra, and create the corresponding red and green mapped areas.
"(For) rCBF we have a threshold below which we consider there is ischemia," he said (ischemia = the area with a rCBF < 66% of the values on the contralateral side (-34% or more). "And within this area we are using an rCBV threshold: above this threshold is penumbra, and below this threshold is infarct (infarct = the area within the ischemia with rCBV < 2 cc/100 g).
 |
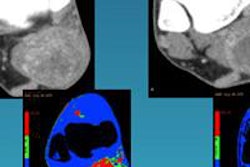
| Recent CT survey of a 62-year-old male patient admitted to our emergency room with a) left hemisyndrome, including a) perfusion CT and b-e) CT angiography (CTA). Above: From the perfusion CT raw data (first line), three parametric maps can be extracted relating to mean transit time (MTT, second line), regional cerebral blood flow (rCBF, third line) and regional cerebral blood volume (rCBV, fourth line), respectively. Applying the concept of cerebral vascular autoregulation leads to a prognostic map (fifth line), describing the infarct in red and the penumbra in green, the latter being the target of thrombolytic drugs. Below: b, c) CTA enables identification of the origin of the hemodynamic disturbance demonstrated by perfusion CT. In this patient, it relates to an occlusion at the right M1-M2 junction (arrows). d, e) Finally, CTA features bilateral calcified atheromatous plaques at both carotid bifurcations (arrowheads). Images courtesy of Dr. Max Wintermark. |
 |
The precise values of these thresholds are the subject of a new multicenter trial Wintermark is leading in an effort to determine the settings that offer the best prognoses. The images were acquired on two multidetector-row scanners (Philips Medical Systems, Andover, MA).
PCT was followed by CTA to assess vessel patency, and both exams were performed before intravenous thrombolytic treatment with rTPA, Wintermark said. PCT was acquired in axial mode at 90 kVp, 150 mAs, with a slice thickness of 2 x 10 mm (Mx8000 Quad) or 2 x 12 mm (Mx8000 IDT), with a rotation time of 0.75 seconds. Intravenous contrast (40 ml iohexol) was administered at a rate of 4-5 ml/sec. PCT images were acquired and specially processed on the Philips PCT software, which produced the infarct/penumbra maps.
CTA was performed using 120 kVp, 240 mAs, with a slice thickness of 4 x 2.5 mm (Mx8000 Quad) or 16 x 1.5 mm (Mx8000 IDT) in spiral mode, pitch 1.5, at 50% overlapping reconstruction following intravenous administration of 70 ml of contrast at 4 ml/sec. The contrast arrival time was based on the CT perfusion series timing, taking into account the seven-second scan delay for the PCT exams.
Finally, diffusion-weighted imaging (DWI) and MRA exams were obtained within six hours and four days, respectively.
Thrombolytic treatment was initiated within 148 ± 30 minutes in 35 patients, while PCT and CTA were performed within 114 ± 45 minutes of the onset of stroke symptoms. Thirty-one patients (89%) had a penumbra (mean LSI = 66% ± 23%). Twenty-seven patients (77%) had internal carotid artery/middle cerebral artery occlusion.
Fourteen patients (40%) had a favorable outcome from thrombolytic therapy (three months NIHSS £ 1). MR angiography showed arterial reopening in 57% of the patients (positive predictor of outcome, multivariate analysis, p=0.001). Also, the predicted perfusion CT infarct coincided with the DWI-predicted infarct, he said.
 |
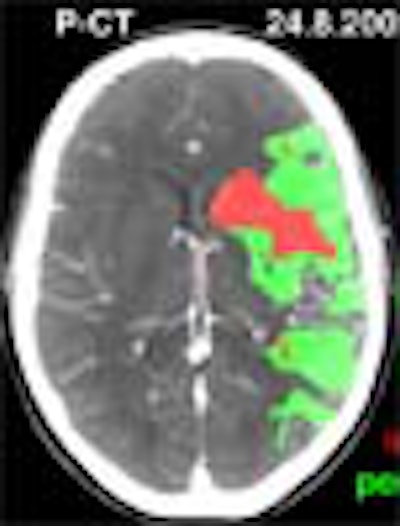
| Above: a) Admission perfusion CT demonstrates mixed infarct and penumbra in the left sylvian territory in a patient with a right hemisyndrome, whereas b) CT angiography (CTA) relates it to an occlusion at the left M1-M2 junction (arrow). The patient underwent intravenous thrombolysis and his clinical condition evolved favorably. Twenty-four hours after admission, d) follow-up CTA features a recanalization of the left sylvian artery, later confirmed on f) MR angiography (MRA). c) Follow-up perfusion-CT shows an almost complete resolution of the penumbra, afforded by the early arterial recanalization. The final perfusion CT infarct has progressed only in a very limited fashion compared to the admission perfusion CT infarct; its extent closely correlates with the abnormality on e) delayed DWI trace image. Images courtesy of Dr. Max Wintermark. |
Strong correlations were found between admission penumbra (mean LSI, 73% ± 18%) and improvement in NIHSS scores within the first 24 hours (70.5% ± 16.5%, P<0.001). Moreover, patients who improved in the first 24 hours had better results at three months. In older patients, however, therapy was associated with a negative prognostic value in older patients, so the institution no longer performs rTPA in patients older than 74, Wintermark said.
As for the prognostic value of the maps, "we were expecting that ... when there was a large penumbra and a small infarct the prognosis will be relatively good; whereas with a large infarct and a small penumbra the outcome will be rather unfavorable," Wintermark said. "(However), the index was not predictive of good outcome in all the patients, but only in the patients with recanalization. Basically, this index tells you what you can expect from the patient if there is recanalization, but it does not predict whether recanalization will occur."
The group is currently evaluating an extended time window from 0 to 6 hours after symptom onset, Wintermark said. "We're (using) the index to know what benefit we can expect from relying on the extent of the infarct to (assess) the risk of hemorrhage, and we are combining the stroke criteria with the treatment. So far we have treated 10 patients without any hemorrhagic complications," he said.
Monitoring therapy
In another RSNA presentation, Dr. Stefan Kloska from the University of Münster presented a preliminary study designed to assess PCT's prognostic value and its ability to monitor tissue reperfusion in acute stroke patients undergoing intravenous thrombolysis.
"For the prognostic value we were looking for the best predictor for the final extent of infarction, and the best predictor of clinical improvement," he said.
"Perfusion CT is able to delineate the site of infarction and the surrounding penumbra at initial perfusion CT," Kloska said. "We used perfusion (assessment) software that allows the calculation of regional perfusion values. We defined an arbitrary area of total ischemia the size of the perfusion abnormality on the CBF map, and an arbitrary area of the ischemic center defined by the perfusion abnormality in the CBV map."
Eight acute stroke patients (mean age, 63.5) who had undergone CT imaging a mean of 1.6 hours (± 0.4 hours) after onset of symptoms were examined using nonenhanced CT, PCT at the level of the basal ganglia and CT angiography, he said.
The size and perfusion values (rCBF, rCBV, rTTP) were measured in the different perfusion maps in the ischemic center and total ischemic area per the above, both before and after thrombolysis. Initial PCT showed a mean size of the total ischemic area at 22.58 ± 10.99 cm2. The ischemic center measured 6.16 ± 3.65 cm2, Kloska said.
Before thrombolysis, there was reduced perfusion on the rCBF (0.30 ± 0.20) and rCBV (0.70 ± 0.20) maps, especially in the ischemic center. After thrombolysis, the rCBF (1.16 ± 0.38) and the rCBV (1.16 ± 0.32) increased, indicating tissue hyperperfusion.
The final infarct size in follow-up CT was 7.16 ± 5.64 cm2. According to the results of regression analysis, the size of rCBV in the ischemic center was the best predictor of the final extent of infarction (r=0.834). The NIHSS score improved by a mean of -7.75 ± 3.28, he said.
"This analysis found the area of the ischemic center defined by the perfusion abnormality in the rCBV map to have the best correlation with the final extent of infarction (r=0.83)," Kloska said. "And for increase of NIHSS score, we found the best correlation for the rCBV map at the site of the ischemic center. So our preliminary results show that perfusion CT allows the monitoring of reperfusion in acute stroke."
By Eric Barnes
AuntMinnie.com staff writer
December 24, 2003
Related Reading
Drinking associated with brain shrinkage, December 5, 2003
Three-minute MRI exam deemed feasible, beneficial, December 2, 2003
New approaches aid CT perfusion for ischemia, May 23, 2003
Copyright © 2003 AuntMinnie.com