An MR spectroscopy (MRS) technique that monitors biochemical changes in tissue showed precancerous breast changes in women with BRCA gene mutations and could improve the management of women at risk of breast cancer, according to a new study published in Radiology.
Women with BRCA1 or BRCA2 mutations have an approximately 50% risk of developing breast cancer before the age of 50, and the cancer can develop within months of a negative screening by mammography. Many women with BRCA mutations choose to have preventive mastectomies to avoid getting invasive cancer later in life.
Study author Carolyn Mountford, PhD, from the University of Newcastle in Callaghan, Australia, and Brigham and Women's Hospital in Boston, and colleagues used 2D localized correlated spectroscopy (L-COSY) to identify biochemical changes associated with a very early stage of cancer development. Mountford's group performed L-COSY on nine women carrying the BRCA1 mutation and 14 women with BRCA2 mutation, comparing them with 10 healthy controls who had no family history of breast cancer.
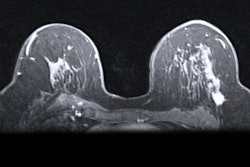
All patients also underwent contrast enhanced 3-tesla MRI and ultrasound, according to Mountford and colleagues.
MRI or ultrasound found no abnormalities, but L-COSY MRS found statistically significant biochemical changes in women with BRCA1 and BRCA2 gene mutations compared to the controls. The changes seem to be early warning signs that may allow women to make informed decisions as to when and if they have prophylactic mastectomy, the group concluded.


![Overview of the study design. (A) The fully automated deep learning framework was developed to estimate body composition (BC) (defined as subcutaneous adipose tissue [SAT] in liters; visceral adipose tissue [VAT] in liters; skeletal muscle [SM] in liters; SM fat fraction [SMFF] as a percentage; and intramuscular adipose tissue [IMAT] in deciliters) from MRI. The fully automated framework comprised one model (model 1) to quantify different BC measures (SAT, VAT, SM, SMFF, and IMAT) as three-dimensional (3D) measures from whole-body MRI scans. The second model (model 2) was trained to identify standardized anatomic landmarks along the craniocaudal body axis (z coordinate field), which allowed for subdividing the whole-body measures into different subregions typically examined on clinical routine MRI scans (chest, abdomen, and pelvis). (B) BC was quantified from whole-body MRI in over 66,000 individuals from two large population-based cohort studies, the UK Biobank (UKB) (36,317 individuals) and the German National Cohort (NAKO) (30,291 individuals). Bar graphs show age distribution by sex and cohort. BMI = body mass index. (C) After the performance assessment of the fully automated framework, the change in BC measures, distributions, and profiles across age decades were investigated. Age-, sex-, and height-adjusted body composition reference curves were calculated and made publicly available in a web-based z-score calculator (https://circ-ml.github.io).](https://img.auntminnie.com/mindful/smg/workspaces/default/uploads/2026/05/body-comp.XgAjTfPj1W.jpg?auto=format%2Ccompress&fit=crop&h=100&q=70&w=100)


![Overview of the study design. (A) The fully automated deep learning framework was developed to estimate body composition (BC) (defined as subcutaneous adipose tissue [SAT] in liters; visceral adipose tissue [VAT] in liters; skeletal muscle [SM] in liters; SM fat fraction [SMFF] as a percentage; and intramuscular adipose tissue [IMAT] in deciliters) from MRI. The fully automated framework comprised one model (model 1) to quantify different BC measures (SAT, VAT, SM, SMFF, and IMAT) as three-dimensional (3D) measures from whole-body MRI scans. The second model (model 2) was trained to identify standardized anatomic landmarks along the craniocaudal body axis (z coordinate field), which allowed for subdividing the whole-body measures into different subregions typically examined on clinical routine MRI scans (chest, abdomen, and pelvis). (B) BC was quantified from whole-body MRI in over 66,000 individuals from two large population-based cohort studies, the UK Biobank (UKB) (36,317 individuals) and the German National Cohort (NAKO) (30,291 individuals). Bar graphs show age distribution by sex and cohort. BMI = body mass index. (C) After the performance assessment of the fully automated framework, the change in BC measures, distributions, and profiles across age decades were investigated. Age-, sex-, and height-adjusted body composition reference curves were calculated and made publicly available in a web-based z-score calculator (https://circ-ml.github.io).](https://img.auntminnie.com/mindful/smg/workspaces/default/uploads/2026/05/body-comp.XgAjTfPj1W.jpg?auto=format%2Ccompress&fit=crop&h=112&q=70&w=112)


