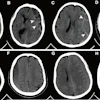
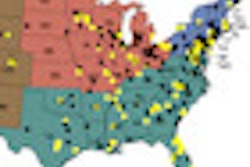
The American College of Radiology's (ACR) Dose Index Registry (DIR) has logged 1 million CT scans from 326 registered facilities since its launch less than a year ago, the organization said.
The registry's quick progress shows that imaging providers are serious about optimizing the radiation doses that patients receive from CT scans, said registry chair Dr. Richard Morin in a statement. Data collected from the registry enable imaging facilities to compare their CT doses to regional and national values. DIR data are also used to establish national benchmarks that will enhance the ability of facilities to track radiation dose reduction efforts over time and, ultimately, reduce radiation doses overall.
Tracking patients' widely varying body habitus is one of the main challenges of any dose registry. But in a November talk reported on AuntMinnie.com, Morin said the registry is on track to begin monitoring patient size beginning in the first quarter of this year.
The Dose Index Registry is part of the overall ACR approach to medical radiation reduction, which includes mandatory accreditation of all medical imaging providers, and widespread use of computerized decision-support systems based on the organization's appropriateness criteria, ACR said. The registry can be accessed on the ACR's website.