Perfusion CT can predict the risk of hemorrhagic transformation in acute stroke patients with accuracy comparable to that of diffusion-weighted MR imaging, say researchers from Massachusetts General Hospital in Boston.
In a presentation at the 2010 RSNA meeting in Chicago, a group led by Leticia Souza, MD, also shared how the best prediction for hemorrhagic transformation comes from the presence of larger volumes of hypoperfused tissue on CT perfusion maps.
Hemorrhagic transformation (HT) is a serious complication of ischemic stroke that increases the mortality risk of stroke more than 10-fold. Severe hemorrhage occurs in about 5% of patients treated with tissue plasminogen activator (tPA), and the percentage increases among those patients treated later following symptom onset. Why study it? Doing a better job of identifying predictors of HT may aid efforts to expand the thrombolytic therapy window beyond current limits.
Several imaging signs have already been associated with the development of hemorrhagic lesions, the most important of which is presentation with a large lesion on diffusion-weighted MR imaging (DWI-MRI), Souza said. Other signs include:
- Number of voxels with low apparent diffusion coefficient values
- Degree of hypoattenuation on CT angiography source images
- Increased permeability on CT perfusion permeability surface maps
- Very low regional cerebral blood flow
Seeking to compare the utility of CT perfusion to that of DWI-MRI as a predictor of hemorrhagic transformation in stroke patients, the research team, which also included Seyedmehdi Payabvash, MD; Shervin Kamalian, MD; Karen Furie, MD; Ramon Gonzalez MD, PhD; and Michael Lev, MD, prospectively examined a total of 96 consecutive patients admitted to the emergency department between April 2008 and April 2009.
National Institutes of Health Stroke Scale (NIHSS) and laboratory values were recorded for each patient who underwent a routine stroke imaging protocol that included nonenhanced CT, CT angiography, CT perfusion imaging, and DWI-MRI, Souza said.
CT images were acquired on 16- or 64-detector-row scanners (LightSpeed, GE Healthcare, Chalfont St. Giles, U.K.) using 80 mL of iodinated contrast and 40 mL of saline. Images acquired at 1.25-mm slice thickness were read using axial 5-mm reformats and three-plane maximum intensity projections.
CT perfusion (CTP) images were acquired using shuttle mode, providing 8 cm of coverage, following administration of 25 mL of iodine and 40 mL of saline. The readers examined 16 slices at 5-mm thickness using CTP3 (GE) software. Finally, DWI-MRI images were acquired on a Signa 1.5-tesla scanner (GE) at TR/TE 5,000 msec/85-110 msec and 5-mm thickness, with a 1-mm gap between sections.
"When analyzing our CTP maps, we decided to look at relative values so we could have better standardization of the results," Souza said.
Using software developed in house, the group first determined the relative voxel values for each of the perfusion maps: rCBF (relative cerebral blood flow), rCBV (relative cerebral blood volume), rMTT (relative mean transit time), and rPS (relative permeability surface). From these data, they determined the volume of ischemic lesions with relative voxel values:
- Less than various thresholds (0.1-0.07) for rCBF and rCBV
- Greater than various thresholds (1.3-2.8) for rMTT and rPS
Mean rCTP voxel values were determined within the hypoperfused lesion to create thresholded rCTP maps at the thresholds that best predicted HT, and DWI-MRI lesions were superimposed on these maps for comparison with MRI.
Follow-up imaging with either noncontrast CT or DWI-MRI was performed in all patients to assess for the presence of HT, with European Cooperative Acute Stroke Study (ECASS) classifications lumped together into HT (including parenchymal hematoma, hemorrhagic infarction) or no HT due to the study's small sample size, Souza said. Univariate statistical analyses included independent sample t-test for continuous variables, chi-square test of categorical variables, and Mann-Whitney rank test for NIHSS scores.
Of the 96 patients included in the analysis, 22 (23%) showed HT on the follow-up scan. Multivariate logistic regression analysis showed that the infarct core tissue volume on DWI-MRI scans as well as the admission NIHSS score are independent predictors of HT, Souza said. Based on separate receiver operator characteristics (ROC) analyses, the volume of hypoperfused tissue with rCBF less than 0.48 in the ischemic hemisphere (area under the curve [AUC] = 0.73) and rMTT greater than 1.3 (AUC = 0.70) were the best predictors of HT in the cohort.
 |
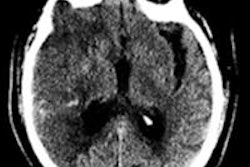
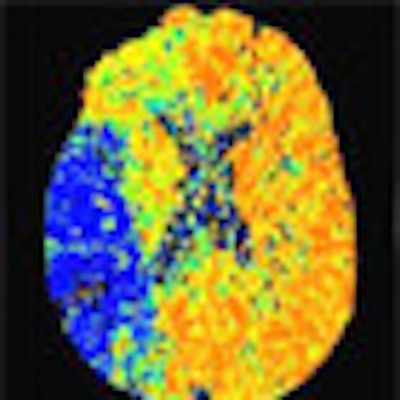
| CT images of an 81-year-old female presenting six hours after the onset of left-sided weakness and right gaze preference; not a candidate for endovascular therapy. (a) 5-mm thick CT angiography source image shows poor tissue opacification of the right middle cerebral artery (MCA) territory. (b) CT angiography maximum intensity projection image shows proximal right MCA occlusion with poor collateralization. (c) DWI-MRI shows right MCA territory infarct core. (d) Thresholded MTT lesion (rMTT > 1.3), with 140 mL total volume. (e) CBV map shows relative hyperemia (increased blood volume) of the cortical right MCA territory. (f) CBF map shows decreased flow of the right MCA territory, corresponding to the DWI lesion. (g) MTT map shows corresponding area of prolonged transit time in the right MCA territory, mean rMTT = 4.3. (h) Twenty-four hour follow-up noncontrast CT shows HT at the anterior right MCA territory. All images courtesy of Leticia Souza, MD, and Shervin Kamalian, MD. |
"Our ROC analysis determined that lesion volumes are based on relative cerebral blood flow below 0.48 [and] relative mean transit times above 1.3," Souza said. "DWI lesion volumes also had very similar areas under the curve when determining HT likelihood."
In fact, these results showed a trend toward higher accuracy than DWI-MRI-based volume (AUC = 0.68, p = 0.21 vs. rCBF, p = 0.10 vs. rMTT). Patients with HT had significantly larger average hypoperfused volumes using both rCBF less than 0.48 (75.2 mL ± 6.9 vs. 53.6 mL ± 5.0, p = 0.033) and rMTT greater than 1.3 (118.5 mL ± 10.0 vs. 89.5 mL ± 6.9, p = 0.041) compared to those without HT.
"No thresholds applied to rCBV and rPS resulted in lesion volumes with an area under the curve above 0.6 in the prediction of HT, so we excluded these parameters from further analysis," Souza said.
Univariate analysis also showed that neither age nor gender influenced progression to HT. However, the mean NIHSS score was higher for those patients who developed HT (mean, 16.5), compared with those who did not (mean, 10.9), and patients who hemorrhaged were more frequently treated with mechanical thrombectomy plus intra-arterial thrombolysis (n = 5, 23%), compared with those who did not.
"All lesions volumes tended to be higher in patients with hemorrhagic transformation including DWI lesions volumes and also lesions based on rCBV below 0.48 and rMTT above 1.3," Souza said. In addition, the mean rCBF and rMTT values within the DWI-MRI lesions were significantly different between patients with and without hemorrhage, and patients with HT tended to present with large vessel occlusions more frequently than those who didn't develop hemorrhagic transformation.
Results: Univariate analysis
|
All lesion volumes were higher in patients with HT than in those without HT, and the two groups are well distinguished, Souza said. All patients presenting with large vessel occlusion developed HT.
Finally, multivariate analysis showed that the mean rMTT within the ischemic lesions greater than 1.3 mL was the only independent predictor of HT within ischemic lesions, Souza said.
- Mean DWI-MRI lesion volumes (p = 0.001)
- Volume of ischemic lesion with rCBF < 0.48 (p = 0.03)
- Volume of ischemic lesion with rMTT > 1.3 (p = 0.04)
Limitations included a study population too small to be stratified by symptoms or ECASS, Souza noted. Also, the study was retrospective, and CT and MRI have slightly different sensitivities. Finally, "it's a little biased because the patients most at risk of developing HT were in advance excluded from therapy," she said.
The hypoperfused tissue volume on admission CT perfusion scans can predict HT risk in stroke patients with comparable accuracy to DWI-MRI infarct volume, Souza concluded.
"This could be of value in making acute stroke management decisions, especially for its negative predictive value in identifying patients at minimal risk for HT," she said.
By Eric Barnes
AuntMinnie.com staff writer
December 22, 2010
Related Reading
MDCT of heart and arteries aids etiologic workup of ischemic stroke, November 9, 2010
CAD algorithm spots acute intracranial hemorrhage, September 20, 2010
Study finds diffusion-weighted MRI tops CT in diagnosing stroke, July 12, 2010
Volume helical shuttle CT perfusion identifies stroke patients, April 20, 2010
Resting fMRI exam may predict stroke and brain injury outcomes, March 30, 2010
Copyright © 2010 AuntMinnie.com