Every minute counts for ischemic stroke patients. Doctors know that for time-critical thrombolytic therapy to be effective, CT scanning should begin within minutes of the patient's arrival in the emergency room.
However, the stroke must be diagnosed before clot-dissolving therapy can begin. And the quickest diagnostic modality, noncontrast head CT, can't match the diagnostic power of contrast-enhanced perfusion CT, which can detect a telltale penumbra even in the absence of morphological signs of stroke.
Trouble is, checking creatinine levels before giving contrast for the perfusion exam drains valuable time from the three-hour thrombolysis window. So does the time-consuming production of perfusion maps. What's a radiologist to do?
Skip the creatinine results, said a presenter at the 2003 European Congress of Radiology. Limit nephrotoxicity with nonionic dimer-based contrast material. And throw together automated CT perfusion maps instead of handcrafted ones.
In 104 patients with suspected brain ischemia, Dr. Martin Petrik and colleagues from the University of Greifswald in Germany found that their timesaving methods provided better diagnoses without evidence of nephrotoxicity.
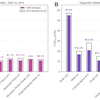
In another ECR presentation, investigators from a major CT manufacturer presented the results of a study of three noise-reducing filters for CT perfusion studies. Only one filter preserved the signal intensity in three critical areas: brain parenchyma, blood vessels, and the area surrounding blood vessels.
Speed rules in stroke patient management
"We wanted to develop a protocol with a minimally nephrotoxic contrast medium and standardized automated generation of the perfusion maps by a radiographer," Petrik said. "We hoped to improve management without any disadvantages for the patients."
Immediately following clinical evaluation and creatinine blood testing, 104 patients (average age, 67) with clinically suspected brain ischemia underwent noncontrast head CT on a single-slice HiSpeed scanner (GE Medical Systems, Waukesha, WI).
Follow-up perfusion CT was performed after administration of 80 ml of iodixanol (Visipaque 320, Amersham Health, Buckinghamshire, U.K.) at 7.2 ml per second. Finally, all patients had comparative MRI studies prior to discharge.
In addition, the group used automatically generated perfusion maps to shorten the normally time-consuming job of creating individualized perfusion maps. Creating them individually wastes time and requires specialized skills, Petrik said.
"After acquisition of the images you have to compute and generate the perfusion parameters," he said. "There’s MTT (mean transit time), CBF (cerebral blood flow), CBV (cerebral blood volume) and time-to-peak."
The faster protocol was a success. Despite their unknown creatinine status at admission, 65% of the patients had normal renal function following contrast administration for perfusion CT. Meanwhile, 39 had renal insufficiency, and only one patient had elevated creatinine levels (381 mmol/l), with no cases of nephropathy resulting from use of the nonionic dimer-based contrast agent.
According to the imaging results, 55/104 (53%) of patients had ischemia that was seen on either noncontrast or perfusion CT, while 49 (47%) had no evidence of ischemia over the course of a week. All patients with morphological signs of infarction also had abnormal perfusion studies. However, 19 of the initially diagnosed infarctions were based solely on the perfusion studies.
"That means 35% of the noncontrast CTs were false-negative," Petrik said.
Seven of the early CT perfusion studies were also false-negative, he said, showing no sign of ischemia. To assess whether the cruder, automated perfusion maps might have been misread, the investigators asked experienced neuroradiologists to create individualized perfusion maps from the same CT data.
However, no additional signs of infarction could be seen with the neuroradiologist-generated maps in any of the seven cases, Petrik said. Thus, noncontrast CT alone yielded a true-positive rate of 65% and a false-negative rate of 35% (n=19). Perfusion CT produced a true-positive rate of 87%, with 13% false negative results.
"Patients with an unknown creatinine level should not suffer a delay in perfusion CT or CT angiography when thrombolysis is still possible," Petrik said. "Automated generation of perfusion maps were acceptable without any disadvantages to the patient. And perfusion CT is a safe and practical examination which only takes a few minutes more, but may improve the diagnostic and therapeutic process considerably."
Asked why the group chose to nearly double the recommended dose of Visipaque, Petrik said a previous study at his institution had shown 80 ml to be the optimum effective dose.
Filtering for sharper perfusion studies
In another ECR presentation, Marcel Quist from Philips Medical Systems of Best, the Netherlands, discussed the effects of three filters on CT perfusion imaging studies. Quist and colleagues achieved better visualization and quantification with the aid of an anisotropic spatial filter for edge-enhanced noise reduction, a process developed by Sherif Makram-Ebeid et al from Philips Research France.
"What should a filter do? First it should reduce noise, but it should also preserve the signal," Quist said. "If we look at CT perfusion data and we want to filter it, we first have to be aware of the variety of Hounsfield profiles. White and gray matter can (range from) 6 to 15 HU, while in the vessels the values can be up to 200 HU. That's a big difference and it causes problems in a conventional filter."
One problem is signal distortion around the bright vessels as far as 8 mm away from the vessel, he said. This distortion is undesirable because tiny vascular structures are then smeared into the surrounding tissue, compromising the quality of quantification.
"The filtering process begins with "motion correction, followed by noise reduction," Quist said. "The next step is to select the artery to compute quantitative perfusion values, and we finalize (by) distinguishing between penumbra and infarct."
The group compared three noise-reduction filters, including a Gaussian filter, which works by removing random noise. Next was a median filter, which evaluates each pixel in the image, and compares it with neighboring pixels to determine whether it is representative of its surroundings, using pixel averaging to smooth out the differences.
Finally they tested an anisotropic filter, which treats different image vectors differently. Anisotropic filters use the magnitude of local intensity gradients to determine which object edges should be preserved compared to less significant gradients.
According to the results, all three filters did a good job of preserving the signal intensity in normal parenchyma that was not near blood vessels, but that was the easy part. In the blood vessels, the Gaussian filter reduced the arterial signal by 70%, and overestimated blood volume by 40%. Moreover, signal intensity around the blood vessels was distorted. The median filter performed similarly, while providing even less noise reduction than the Gaussian filter.
In contrast, the anisotropic filter preserved 96% of the arterial signal, while overestimating blood volume by just 4%. Visually, the tissue and vasculature were both clearly delineated.
"The better the edges are preserved, the smaller the infarcts that you're able to detect," Quist said.
 |
 |
 |
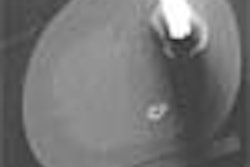
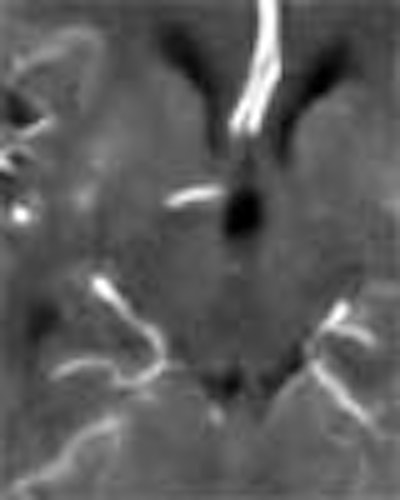
| Top image: original CT perfusion data shows brain parenchyma and opacified blood vessels (white), as well as substantial image noise. Middle image: same CT data after Gaussian filtering, which reduces image noise, but also reduces signal intensity in the blood vessels and distorts the signal in areas surrounding the vessels. Bottom image: Same data following application of anisotropic filter, which reduces image noise while preserving tissue boundaries. The boundaries are preserved by elongating the filter in a parallel orientation with the edges, such that the filter remains sufficiently large for appropriate noise reduction, but avoids mixing of several tissue types. All images courtesy of Marcel Quist. |
"There's one winner here, and the anisotropic filter performs best overall," he said. "Overall signal preservation is essential for quantitative analysis, and that's why we have included this anisotropic filter in our software."
While the motion-correction process is a separate step, it is not too time-consuming, he said, adding that the anisotropic filter itself is fully automated and designed for use in the emergency room.
By Eric BarnesAuntMinnie.com staff writer
May 23, 2003
Related Reading
AHA releases new guidelines for urgent stroke evaluation and management, April 4, 2003
MRI alters course of thrombolytic treatment for stroke, March 25, 2003
Perfusion CT offers speedy access, but MRI gives the "big" picture, February 19, 2003
Stroke strategy improves outcomes, cuts costs, January 9, 2002
Perfusion-weighted CT predicts stroke outcome after thrombolysis, September 12, 2001
Copyright © 2003 AuntMinnie.com