

The estimated global economic cost of cancers from 2020 to 2050 is expected to be over $25 trillion, led by cancers of the trachea, bronchus, and lung, according to a report published February 23 in JAMA Oncology.
A team led by Dr. Simiao Chen from the Heidelberg Institute of Global Health in Germany found that this is equivalent to an annual tax of 0.55% on global gross domestic product.
"The findings suggest that global efforts to curb the ongoing burden of cancers are warranted," Chen and colleagues wrote.
Previous studies in the literature have examined the economic burden presented by cancer but have looked at either one or a limited number of countries. The researchers also pointed out that most previous studies didn't account for "the dynamics of morbidity and mortality-related changes in the population," as well as the implications of treatment costs for savings.
Chen and colleagues wanted to estimate the macroeconomic cost of all cancers for most countries in the world. They used a decision analytical model that incorporates economic feedback in assessing health outcomes tied to labor force and investment. The model accounted for the following factors: the association of cancer-related mortality and morbidity with labor supply; age-sex-specific differences in education, experience, and labor market participation of those who are affected by cancers; and the diversion of cancer treatment expenses from savings and investments. The team collected the data in April 2022.
Using the model, the researchers analyzed macroeconomic costs for 29 different cancers across countries and territories. They found that these aggregate costs amounted to $25.2 trillion at constant 2017 prices. It also found that the five cancers with the highest economic costs are those related to the trachea, bronchus, and lung (15.4%); those related to the colon and rectum (10.9%); breast cancer (7.7%); liver cancer (6.5%); and leukemia (6.3%).
Additionally, the findings suggested that China and the U.S. face the largest economic costs of cancers in absolute terms, accounting for 24.1% and 20.8% of the total global burden, respectively.
Finally, while 75.1% of cancer deaths occur in low- and middle-income countries, their share of the economic cost of cancers is lower at 49.5%, the researchers reported.
The study authors wrote that high-income countries bear the highest macroeconomic costs; low- and middle-income countries bear much of the human toll. They added that this underscores the need for improvements on multiple fronts, including health system strengthening and public health policies to reduce tobacco use.
"Otherwise, as low- and middle-income countries develop, an economic cost will accompany the human cost they already incur," the authors wrote.
They also wrote that knowing the economic costs can aid policymakers in creating and enacting strategies to curb increases in cancer-related mortality and morbidity, as well as allocate resources and build health systems that can handle expected increases in cancer prevalence.
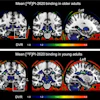


![A normal mammogram confirmed by three-year radiologic follow-up illustrates reader-marked regions of interest (ROIs) during (A) unaided (round 1) and (B) artificial intelligence (AI)–assisted (round 2) reading. Each colored dot represents an ROI for recall by a human reader. Readers could mark more than one ROI per case, represented by multiple dots of the same color. During AI-assisted reading, the AI system displayed three visible prompts: two with suspicion of malignancy scores of 35% (left mediolateral oblique [L MLO] and craniocaudal [L CC]) and one with a suspicion of malignancy score of 10% (right craniocaudal [R CC]), shown as polygonal overlays. Without AI, six of 10 readers (60%) marked a false-positive ROI. With AI assistance, this fell to two of 10 (20%). R MLO = right mediolateral oblique.](https://img.auntminnie.com/mindful/smg/workspaces/default/uploads/2026/07/2026-07-14-radiology-mammogram-ai-auto-bias.H0bYO8QlWs.jpg?auto=format%2Ccompress&dpr=2&fit=crop&h=167&q=70&w=250)


