The CT portion of a hybrid PET/CT scan is commonly, and successfully, used for attenuation correction in these studies. Because acquisition during these exams is not simultaneous for each modality, nor is temporal resolution equivalent, the potential for data misregistration exists -- particularly in the thorax and upper abdomen.
A team of scientists from Germany has developed a method of automated emission correction that shows promise for image registration between the technologies, especially for cardiac studies.
"In our center, several PET/CT perfusion studies had moderate-to-severe PET/CT misregistration, and we observed apparent perfusion defects in spatial coincidence with the misregistered segments," the authors wrote in a study published in the Journal of Nuclear Medicine (February 2007, Vol. 48:2, pp. 188-193).
The scientists are from the nuclear medicine clinic and polyclinic, as well as the computer aided procedures and augmented reality lab, at Technischen Universität München in Munich. They investigated whether the defects could be artifacts that originated from an incorrect attenuation correction due to emission-transmission misregistration.
"We assumed the severe difference between the attenuation factors of the lung, where there is virtually no attenuation, and that from the heart tissue to be the underlying reason for reduced uptake in the misregistered cardiac segments," they wrote.
The researchers examined 28 consecutive patients (20 men, 8 women; average age of 63 years) referred for coronary disease evaluation with a PET/CT rest/stress perfusion study. All studies were conducted on a Siemens Medical Solutions (Erlangen, Germany) Biograph 16 PET/CT system.
The scientists reported that thorax transmission data was acquired with a low-dose CT scan of 120 kVp and 26 mAs performed while the patients were shallow breathing in the arms-down position. The patients then received a 300-500 MBq injection of 13N-ammonia (13NH3) at the start of the PET acquisition, which lasted for 10 minutes.
The stress portion of the PET exam was performed 30 minutes later with a six-minute infusion of adenosine, after which the patients underwent a second 13N-ammonia exam for 10 minutes. Data from five to 10 minutes after the injections was summed and used for analysis, according to the researchers.
"To investigate whether emission-transmission misregistration was at the origin of perfusion defects, we sought to remove the misregistration by realigning the CT to the PET and repeating the PET reconstruction with the aligned CT-based attenuation map," the authors wrote.
The team achieved this goal by developing a registration program that permitted three different methods for realigning the PET and CT exams: manual registration, automatic registration, and an in-house created emission-driven correction method that modified the heart outline on the basis of the PET data. All three realignment techniques were applied separately to each of the PET/CT studies conducted by the team.
 |
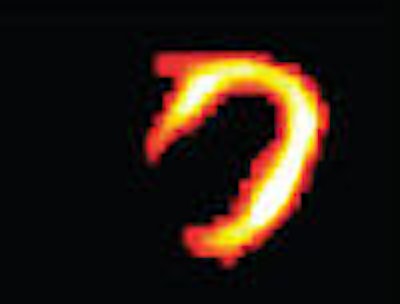
| Segmentation of left ventricle (LV) used by emission-driven algorithm. (A) Central transaxial plane of initial PET image. (B) Image after masking left side and applying a strong smoothing filter; spatial center of the LV is assumed to be roughly the point with maximum intensity in image. (C) 3D ellipsoid defined around spatial center; 3D ellipsoid is a circle in each transaxial plane. (D) Segmentation results after histogram thresholding within ellipsoid. Reprinted with permission from "Artifacts from Misaligned CT in Cardiac Perfusion PET/CT Studies: Frequency, Effects, and Potential Solutions," Axel Martinez-Möller, Michael Souvatzoglou, Nassir Navab, Markus Schwaiger, and Stephan G. Nekolla, February 2007 Journal of Nuclear Medicine. |
For the manual and automatic PET/CT registration methods, the scientists noted that registration was limited to a translation between the datasets in all three spatial directions. The manual registration was done by moving the CT image over the PET image and assessing the overlap in fused PET/CT in the coronal, sagittal, and transaxial views.
"Careful manual registration required 30- to 60-seconds for a PET/CT dataset," the authors observed.
The automatic registration technology utilized normalized mutual information as the similarity measure for its optimization algorithm. It searched all transformation parameters and checked all possible spatial transformations to find the one with the highest similarity, with a displacement in each direction of no larger than 3 cm. This technique required a run time of approximately 20 seconds for each PET/CT dataset.
"The emission-driven correction is an in-house-developed method based on the following assumption: If there is tracer uptake corresponding to the left ventricle (LV) on the PET image, the corresponding voxel in the CT should contain cardiac tissue as well," the authors wrote. "However, in case there is an inconsistency and the voxel contains lung tissue and, therefore, nearly no attenuation, the value of the voxel is modified to match that of cardiac tissue."
The segmentation and modification of the attenuation map required less than one second to run on a standard personal computer, the researchers reported.
The group evaluated the misalignment between the PET and CT datasets after manual registration, and found that it averaged 6.1 mm for the 28 rest acquisitions and 6 mm for the stress acquisitions. They noted that registration had noticeable effects when the misalignment was greater than 6 mm, which occurred in half the exams, and if greater than 8 mm, the effects on tracer uptake were severe.
The scientists reported that the automatic registration algorithm did not improve the cardiac registration when applied to the complete dataset, because the effects of a misaligned heart are technically compensated by a reasonably well-aligned thorax. They also attempted a cardiac structure-only approach with the automatic registration algorithm, but found the low correlation between the functional and anatomic images did not allow them to properly assess the similarity between both datasets.
The emission-driven correction technology demonstrated a good correlation with the manual registration of the images, according to the researchers.
"Mean local differences in uptake between the studies corrected by manual registration and by the emission-driven algorithm were all nonsignificant and were within a 2% interval, indicating good agreement between both approaches," they wrote.
By Jonathan S. Batchelor
AuntMinnie.com staff writer
March 9, 2007
Related Reading
PET identifies inflammation severity in carotid plaques, November 21, 2006
New growth for diagnostic radiopharmaceuticals, November 9, 2006
Instrumentation, attenuation correction steer nuclear cardiology's future, October 23, 2006
PET perfusion can predict cardiac events, March 15, 2006
PET, SPECT measures of LVEF have superior predictive value, March 13, 2006
Copyright © 2007 AuntMinnie.com