Cardiac MRI is opening a new diagnostic window on pulmonary hypertension (PH), according to a pair of studies from Mount Sinai Medical Center in New York City.
PH is characterized by elevated pulmonary artery pressure that can become life-threatening. Although pharmacologic treatment continues to increase life expectancy for many patients, accurate and early diagnosis is considered crucial to pinpointing the many treatable etiologies underlying PH, from bronchitis to congenital heart abnormalities.
Except for echocardiography, with its potentially variable results, noninvasive tests have been lacking, leaving right-sided heart catheterization (RHC) as the gold standard.
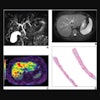
The two cardiac MR (CMR) papers, both in the April issue of Radiology and from researchers at Mount Sinai's Henry R. Kravis Center for Cardiovascular Health, use different CMR measurements to glean their diagnoses. First, Dr. Santo Dellegrottaglie and his group detected PH by measuring the ventricular septal-to-free-wall curvature ratio.
The second study, led by Dr. Javier Sanz, used phase-contrast MRI to determine that average blood velocity is strongly correlated to pulmonary pressure and resistance.
The results of both studies were well correlated to right-side heart catheterization procedures performed the same day.
Curvature ratios estimate RV systolic pressure
The right ventricular systolic pressure (RVSP) can be noninvasively estimated using Doppler echocardiography by measuring the tricuspid regurgitation peak velocity, Dellegrottaglie and colleagues wrote.
"However, the clinical feasibility of this technique may be substantially affected by several conditions, such as absence of a detectable jet of tricuspid regurgitation, limited acoustic window, and advanced lung disease," they wrote (Radiology, April 2007, Vol. 243:1, pp. 63-69).
In previous studies using CMR or echocardiography, distortion of the LV cavity has been observed in PH patients, and quantified by measuring the interventricular septal curvature or the curvature ratio cycle, the authors wrote. "Patients with PH may have a substantially reduced transseptal pressure gradient, which may lead to the frequently observed flattening (or bowing) of the (interventricular septum)," they noted.
In their retrospective study, the group used CMR measurements to test the accuracy and reproducibility of ventricular septal-to-free-wall curvature ratio to predict RVSP in 61 patients with known or suspected PH.
All patients underwent CMR and RHC on the same day. CMR images were acquired on a 1.5-tesla scanner (Magnetom Sonata, Siemens Medical Solutions, Malvern, PA) equipped with a multielement phased-array surface coil. First, a series of survey chest images were acquired in transverse, coronal, and sagittal phases to localize the heart and obtain breath-hold localizer images in the two-chamber short-axis view and the four-chamber view.
Then, using the four-chamber view, an ECG-gated steady-state free precession sequence was used to acquire short-axis image planes of the LV. Cine images were acquired (repetition time 3.2, echo time 1.6 seconds) using a flip angle of 60° to 90°, 8-mm section thickness, 256 x 166 matrix, acquired temporal resolution of 33-45 msec, 11-15 segments, 20-25 reconstructed cardiac phases, and bandwidth of 900-1,000 Hz/pixel. All images were reviewed on a Leonardo (Siemens) workstation.
RHC was performed with fluoroscopic guidance using a four-lumen thermodilution catheter and a multiparameter monitor, the group wrote.
The researchers used interventricular septal curvature (CIVS) and left ventricular free wall curvature (CFW) measurements at end systole to derive the curvature ratio (CIVS/CFW). The effective distending transmural pressure and transseptal pressure gradient were assumed to be equivalent to systolic blood pressure (SBP), and the difference between SBP and RVSP. Then the curvature ratio and SBP were used to estimate RVSP. They also performed linear regression analysis to determine the difference between curvature ratio and rate of pressure rise (dP) ratio (dPIVS/dPFW).
The results confirmed pulmonary hypertension (RVSP > 40 mm Hg) in 46 of the 61 patients, and found "a direct linear correlation between dP ratio and curvature ratio (r = 0.85, p < 0.001)," the authors wrote. Bland Altman analysis showed moderate agreement between RVSPs derived from CMR and RHC, with a mean difference of -1.1 mm Hg ± 15.9 SD.
"ROC analysis of the accuracy of the curvature ratio for detection of increased RVSP revealed 87% sensitivity and 100% specificity (area under the ROC curve, 0.95; p < 0.001)," the group wrote. There was also close correlation between intraobserver (r = 0.97) and interobserver (r = 0.95) curvature ratio measurements.
With the aid of same-day RHC studies, "we demonstrated that cardiac MR-derived curvature ratio measurements are accurate and reproducible in the prediction of RVSP," the authors wrote. The formula for noninvasive evaluation of RVSP "represents a simple method of measuring RVSP noninvasively from the known SBP and curvature ratio," they added.
Although the curvature enabled the prediction of PH with high sensitivity (87%) and specificity (100%), "concordance of curvature ratio measurements with invasive measures was not perfect," the authors noted, perhaps owing to hemodynamic changes associated with the two-hour delay between studies, or to the administration of sedatives to calm some claustrophobic MRI patients.
Other limitations may be due to the assumptions made in calculating the LV wall stress forces in the free wall and IVS. In addition, LV systolic pressure was estimated from SBP, which may not be applicable in patients with aortic valve disease.
In patients with known or potential PH, "cardiac MR-derived curvature ratio, as compared with RHC measurement, was an accurate and reproducible index for estimation of RVSP," they concluded.
Blood flow velocity affected by PH
In the second study, Sanz and colleagues used phase-contrast MR imaging to identify pulmonary artery flow parameters, enabling the noninvasive diagnosis of PH.
"Pulmonary hypertension is classified into five diagnostic categories: pulmonary arterial hypertension (PAH), PH with left-sided heart disease, PH associated with lung disease and/or hypoxemia, PH due to chronic thrombotic and/or embolic disease, and a miscellaneous group," the authors explained. "Disorders leading to PAH are associated with a particularly ominous outcome" (Radiology, April 2007, Vol. 243:1, pp. 70-79).
The diagnostic gold standard for these conditions, right-sided heart catheterization, "carries a small but definite risk of severe complications," the group wrote. Doppler ultrasonography of the flow through the tricuspid and pulmonary valves is a well-established noninvasive alternative; however, "suboptimal acoustic widows" may hamper visualization in some patients.
For this study, phase-contrast CMR was chosen for its demonstrated accuracy in blood flow quantification, which the authors employed retrospectively in an effort to diagnose PH noninvasively.
In all, 59 patients with known or suspected PH underwent breath-hold phased-contrast CMR on a 1.5-tesla scanner (Magnetom Sonata, Siemens Medical Solutions) using a phased-array surface coil and ECG gating. RHC was performed within two weeks of MR.
After acquiring localizer views and contiguous short-axis cine views of both ventricles during end-expiratory breath-holds, the researchers acquired two double-oblique views along the pulmonary trunk using a steady-state free precession sequence. The cine loops were used to prescribe a plane perpendicular to the main PA for the acquisition of phase-contrast MR images, "and to ensure that the imaging plane remained between the pulmonary valve and the PA bifurcation throughout the whole cardiac cycle," they wrote.
Phase-contrast MR data were acquired with a segmented fast gradient-echo MR sequence (22) with an upper velocity limit of 100 cm/sec that was increased in 50-cm/sec increments if aliasing was noted. Patients were encouraged to hold their breath for the entire acquisition. Imaging parameters included TR/TE 7.5/3.1, 15º flip angle, 6-mm section thickness, field-of-view of 320-380 x 240-300 mm, 256 x 96 matrix, and five to seven segments at a temporal resolution of 75-105 msec, with reconstruction of 20 phases. Special software (Argus, Siemens) was used for image postprocessing.
RHC was performed in a standard manner by placing a Swan-Ganz catheter with a 7.5-F introducer.
The results showed that average blood velocity throughout the cardiac cycle was strongly correlated to pulmonary pressure and resistance.
Average velocity had the best correlation with mean pulmonary artery pressure, systolic pulmonary artery pressure, and the pulmonary vascular resistance index (r = -0.73, -0.76, and -0.86, respectively). "The average velocity (cutoff value = 11.7 cm/sec) revealed PAH with average sensitivity of 92.9% (39 of 42) and a specificity of 82.4% (14 of 17)," Sanz and his colleagues reported. "Sensitivity and specificity for the minimum pulmonary artery area (cutoff value = 6.6 cm²) were 92.9% (39 of 42) and 88.2% (15 of 17), respectively."
The group noted that previous studies have shown a number of potential uses for phase-contrast MR-derived measurements, including pulmonary artery dimensions and strain, acceleration volume, and flow upslope.
"In our study, the minimum PA area was useful in detecting the presence of PAH," they wrote. But there were limitations, including "more difficult contour tracing in diastole when proton inflow (and therefore blood signal intensity) was lower." Alternatively, the group noted that measurements of acceleration time and ejection time have been well correlated to pulmonary measures and resistance in Doppler echocardiography, though inconsistent results have also been reported.
In the current study, the significant but weak correlation between acceleration time and RHC "may have been due in part to the limited temporal acquisition of our protocol," they wrote.
The average velocity of PA flow was the single most useful parameter in the present study, Sanz and colleagues stated. The results in a larger group of patients with PAH "confirm a significant though weaker correlation between peak velocity and pulmonary pressures and resistance, whereas average velocity had the best correlations with hemodynamic measurements (r ranging from -0.73 to -0.086)" the authors noted. "These findings suggest that as pulmonary pressures and resistance increase, the circulation of blood through the pulmonary vascular bed is globally hampered and progressively slows."
Only patients with PAH were included in the study, and it is unknown whether the results will apply to other groups of PH patients, the group cautioned. "In patients with chronic PAH, a variety of flow measurements in the pulmonary trunk evaluated with phase-contrast MR imaging correlate with the degree of hemodynamic disturbance as determined with the level of pulmonary pressures and vascular resistance."
The strong correlation between average blood velocities and pulmonary pressures and resistance suggests that this parameter can be used to detect the presence or absence of PAH, and evaluate treatment response, they concluded.
By Eric Barnes
AuntMinnie.com staff writer
April 9, 2007
Related Reading
Tissue Doppler aids pulmonary hypertension assessment, March 12, 2007
Myocardial functional reserve reduced in hypertension and diabetes, September 7, 2006
Mild hypoxemia linked with right ventricular hypertrophy in COPD, June 30, 2005
High osmolarity agent beats gadolinium in cardiac MR, May 30, 2006
RV function scans integrated with chest CT, May 9, 2005
Copyright © 2007 AuntMinnie.com