Hepatobiliary Imaging of Other Disorders
Bile Leak:
The incidence of bile leaks after laparoscopic cholecystectomy is
approximately 0.5-2% [3,5]. Subclinical or asymptomatic bile leaks
after laparoscopic cholecystectomy have a prevalence of 7% [5].
Usually several days pass before a leak is diagnosed because the
symptoms are non-specific [3]. The most common location for bile
to collect from a post-cholecystectomy leak is in the
gallbladder fossa. The leak typically occurs from the cystic duct
stump or the ducts of Luschka (also known as the subvesical or
accessory biliary ducts) which originate in the right hepatic
lone, course along the gallbladder fossa, and drain variably into
intra- and extrahepatic biliary ducts (these udcts can be injured
during surgical dissection) [5]. Ducts of Luschka that communicate
with the extrahepatic biliary duct tend to result in larger
volumes of bile extravasation than those that do not communicate
with the central biliary system [5].
On imaging studies, bile collections are usually close to the site of the leak, but occasionally they can be remote or intrahepatic [3]. Small leaks (ie: those in which the majority of bile still drains into the small bowel) may be managed conservatively and usually heal spontaneously. Complications from bile leak include abscess formation and peritonitis.
Bile leaks can occur from:
- Iatrogenic disruption of the CBD:
- Open cholecystectomy (0.2%): Insignificant bile leaks are actually very common (about 40% of cases), but these usually heal spontaneously.
- Laparoscopic Cholecystectomy (Up to 2%)
- Inflammation:
- Acute cholecystitis with perforation
- Peptic ulcer disease
- Inflammatory bowel disease
- Post-traumatic
- Neoplasm
The scintigraphic finding diagnostic for a bile leak is extravasation of tracer activity into the peritoneal cavity. Up to 50% of bile leaks can be missed, however, if delayed images (at 4 hours) are not performed. Delayed images are helpful because the bile leak activity will frequently intensify over time. Most bile leaks will be detected in 4 to 6 hours, but rarely a leak may not be identified until 24 hours after injection. Therefore, 24 hour delayed images should be obtained. A diagnostic tap of peritoneal fluid can be imaged to see if it contains radioactivity.
|
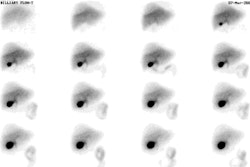
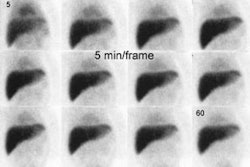
Bile Leak: The post-cholecystectomy patient shown below was being evaluated for abdominal pain and fever. The CT scan demonstrated a fluid collection anterior to the liver (white arrows- click CT image to enlarge). A hepatobiliary study demonstrated a bile leak. Increasing tracer activity can be seen over the liver corresponding to the fluid collection on the CT scan. Bile can also be seen pooling in the gallbladder fossa and extending down the right paracolic gutter. |
|
|


|
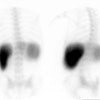
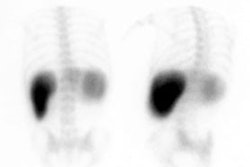
Bile Leak: This is another example of a bile leak. The hepatobiliary exam demonstrated pooling of tracer in the porta hepatis in this post-laparoscopic cholecystectomy patient. No bowel activity was appreciated. The percutaneous cholangiogram revealed that the common bile duct had been clipped (white arrow) at surgery. |
|
|


Sphincter of Oddi Dyskinesia: (Biliary Dyskinesia)
A functional disorder of the biliary tract which is felt to be related to a paradoxical response of the sphincter of Oddi to CCK (Contraction rather than relaxation). Patients complain of RUQ pain and the disorder can be found in both pre- and post cholecystectomy patients (about 10% of patients experience persistent symptoms following cholecystectomy). On manometry, these patients are found to have elevated sphincter of Oddi pressures (over 20 mm Hg). Treatment is sphincterotomy or sphincteroplasty.
Scintigraphic findings in this syndrome include delayed biliary-to-bowel transit and a dilated common duct sign (due to failure of the sphincter of Oddi to relax) after CCK administration. Paradoxical filling of the gallbladder following sincalide administration can also be seen [4]. These patients, however, tend to have a normal gallbladder ejection fraction.
Cystic Duct Syndrome:
Characterized by partial non-calculus obstruction of the cystic duct secondary to fibrosis, kinking, or adhesions. The disorder often occurs in conjunction with chronic acalculous cholecystitis. Patients complain of recurrent RUQ pain and biliary colic.
Cystic Duct Remnant:
Following cholecystectomy, a cystic duct remnant may simulate a diseased gallbladder and cause persistent symptoms. On scintigraphy, a cystic duct remant should be considered when activity is noted in the gallbladder fossa that simulates the appearance of a small gallbladder. Imaging should be continued for 4 hours or longer to maximize the likelihood for detecting the remnant.
Rotor's Disease:
An inherited hyperbilirubinemia characterized by abnormal uptake and storage of bilirubin by the hepatocytes which results in an elevated serum bilirubin (mostly conjugated).
On scintigraphic imaging there is slow uptake of the tracer by
the liver, with
unimpaired excretion and persistent visualization of the cardiac
blood pool, kidneys, and
urinary tract for up to 6 hours. This can mimic severe hepatitis.
The gallbladder is
visualized, but somewhat delayed. Renal excretion of the tracer is
also seen.
Radionuclide Imaging of Hepatic Masses:
| Disease | Liver-Spleen | HIDA | Gallium | Tc-RBC's |
|---|---|---|---|---|
| Adenoma | Focal Defect. Varying reports of uptake. | Often no uptake. May show uptake, but no excretion. | Uptake similar to normal liver, but may be increased | Similar to normal liver, may be slightly increased |
| Focal Nodular Hyperplasia | Normal (60%), Cold (30%), Hot(10%) | Increased flow with uptake and accumulation similar to normal liver, but delayed wash out. Probably due to abnormal canaliculi. | Uptake similar to normal liver, but may be increased | Similar to normal liver, may be increased |
| Hemangioma | Focal Defect | Focal Defect | Focal Defect | Hypoperfused, but hot spot on delayed images |
| Fatty Infiltration | Normal | Normal | Normal | Normal |
| Hepatoma | Focal Defect on delayed images, but may demonstrate increased activity on early angiographic flow images | Initial cold defect (first 30-60 min.), may show late (2-4 hour) uptake without washout which is fairly specific for hepatoma. | 95% show uptake, 50% with uptake greater than normal liver | Normal, but may rarely see increased activity on flow and delayed images |
| Macro Regenerating Nodule | Good uptake, but the remainder of the liver may be decreased due to cirrhosis. May also appear as cold area | Good uptake and excretion | Good uptake, remainder of liver may be decreased due to cirrhosis | Similar to normal liver |
[From Drane, Imaging of the Liver and Biliary Tree; and Zeissman]
Focal Nodular Hyperplasia:
On IDA imaging increased flow is generally noted to the lesion (75% of cases). Uptake of the tracer on early images is generally equal to the surrounding liver. Delayed clearance from the lesion with persistent activity greater than the surrounding liver at 60 minutes is very common and is seen in up to 92% of lesions. This delayed clearance is felt to be secondary to a bile canaliculi abnormality (Remember- delayed clearance of tracer has also been described in hepatoma). A "doughnut" pattern of activity on late images may ocassionally be seen (8%). Rarely, these lesions may contain few hepatocytes, in which case they may appear as a defect on hepatobiliary scintigraphy.
On sulfur colloid imaging, increased uptake is found in 15% of lesions, normal uptake in 50%, and decreased uptake in 35% [1]. On gallium imaging FNH usually appears isointense or slightly increased in intensity to the surrounding liver parenchyma. [2]
On red blood cell imaging, the perfusion to the lesion may be increased or normal, but delayed images will show the lesion to have uptake equal to that of the surrounding liver parenchyma.
Hepatocellular Carcinoma:
Between 35 to 60% of hepatomas demonstrate uptake of IDA derivatives. Uptake is typically slower than the adjacent normal liver and delayed views (2-4 hour) are usually necessary to demonstrate tumor avidity for the tracer. Tumor uptake is related to the degree of differentiation of the tumor. Approximately 70% of well differentiated hepatomas showed uptake, while no poorly differentiated tumors did [2]
Hepatic Arterial Perfusion Scintigraphy: (HAPS)
This method involves the administration of Technetium Macroaggregated albumin via a hepatic artery catheter placed distal to the origin of the gastroduodenal artery in order to minimize delivery of the tracer to the gut. The dose used is approximately 4 mCi of Tc-MAA diluted such that less than 200,000 particles are delivered in a 4-5 ml volume over 1 to 2 minutes. Rapid injection should be avoided as this may cause streaming of the tracer with non-uniform hepatic flow, or reflux of tracer into the celiac axis and extra-hepatic activity. HAPS was originally developed to determine the location of chemotherapy delivery through a surgically placed hepatic artery infusion catheter, but this technique may also provide detailed information regarding the presence of hepatic metastases. This is because even hypovascular tumors receive the vast majority of their blood flow from the hepatic artery, whereas normal liver derives 75-80% of its flow from the portal venous system. Thus, any focal area of increased tracer activity in comparison to the lattice of normal hepatic perfusion, is considered abnormal. Hot spot image detection is dependent upon contrast and not spatial resolution. If significant target to background differences are achieved, lesion size is really irrelevant. In general, most mets have uptake ratios compared to normal liver of between 2 to 6:1. Small lesions usually have uniform uptake, while larger lesions typically have a "ring-like" appearance due to central necrosis. The sensitivity of HAPS in a limited number of patients has been reported to be 97%, with a specificity of 50%. However, 3 of 6 false positive studies subsequently developed lesions at the locations suggested by the HAPS exam.
Concurrent sulfur colloid imaging is also beneficial as a defect on the Tc-SC scan at the exact location of a focus of hyperperfusion on HAPS is a powerful predictor for a metastatic lesion.
HAPS in the Evaluation of Hepatic Intra-arterial Chemotherapy:
For the treatment to be successful with minimal side effects, the drug must reliably be delivered to the tumor. If the catheter is not properly placed, there will be inadequate delivery of the agent to the tumor and extrahepatic distribution to the lungs, stomach, pancreas, small bowel, and spleen. The high flow rates and large catheters necessary for angiography make it less than ideal for this type of evaluation. Normally, a small amount (1 to 7%) of extrahepatic activity can be expected secondary to A-V shunting. Shunting of more than 10-40% is associated with the potential for serious systemic/gastrointestinal side-effects. The frequency of toxicity increases with the amount of shunting. Gastric complications from this include gastritis, ulceration, and hemorrhage. Increased pulmonary activity generally indicates arteriovenous communications within the tumor and implies that there will be similar shunting of the chemotherapeutic agent.
REFERENCES:
(1) J Nucl Med. 1993; Boulahdour H, et al. The hot spot hepatobiliary scan in focal nodular hyperplasia. 34(12):2105-10
(2) Nuclear Medicine Annual 1994; Middleton ML, et al. Hepatic mass lesions: Scintigraphic update with emphysis on hemangioma detection. Ed. Freeman LM. Raven Press, Ltd. New York. 55-90
(3) AJR 2004; Kapoor V, et al. Bile leaks after surgery. 182: 451-458
(4) J Nucl Med 2006; Krishnamurthy S, Krishnamurthy GT. Effect of
sequential administration of an opiod and cholecystokinin on
gallbladder ejection fraction: brief communication. 47: 1463-1466
(5) Radiographics 2013; Patel NB, et al. Multidetector CT of emergent biliary pathologic conditions. 33: 1867-1888