The following is the list of candidates for the 2022 edition of the Minnies, AuntMinnie.com's campaign to recognize the best and brightest in medical imaging. This year's campaign includes over 200 candidates in 14 categories, ranging from Most Influential Radiology Researcher to Best Educational Mobile App.
The semifinalist list was compiled based on nominations from members of AuntMinnie.com. Winners will be selected by our expert panel in two rounds of voting. The finalists will be announced in late September, with the final winners announced in October.
Most Influential Radiology Researcher
Dr. Aashim Bhatia, Children's Hospital of Philadelphia
Dr. Jeffrey Chang, Greensboro Radiology
Simon Cherry, PhD, University of California, Davis
Dr. Hugh Curtin, Harvard Medical School
Dr. Dania Daye, PhD, Massachusetts General Hospital
Dr. Adam Flanders, Thomas Jefferson University
Dr. Cree Gaskin, University of Virginia Health System
Krzysztof Geras, PhD, New York University
Maryellen Giger, PhD, University of Chicago
Dr. Robert Gilkeson, Case Western Reserve University
Dr. Amit Gupta, University Hospitals Cleveland Medical Center
Dr. Kate Hanneman, University of Toronto
Danny Hughes, PhD, Georgia Institute of Technology
Dr. Andrei Iagaru, Stanford University
Dr. Diego Jaramillo, Columbia University
Dr. Phillip Kuo, PhD, University of Arizona
Dr. Kirti Magudia, PhD, Duke University
Dr. Randy Miles, Denver Health
Dr. Ivan Pedrosa, PhD, University of Texas Southwestern Medical Center
Dr. Martin Pomper, PhD, Johns Hopkins University
Dr. Claude Sirlin, University of California, San Diego
Most Effective Radiology Educator
Dr. Ryan Avery, Northwestern University
Dr. Rachel Brem, George Washington University Hospital
Dr. Peter Chang, University of California, Irvine
Dr. Kal Clark, University of Texas San Antonio
Dr. Jocelyn Chertoff, Dartmouth Hitchcock Medical Center
Dr. Sonia Gupta, Radiology Associates of Florida
Dr. Elizabeth Hawk, PhD, Stanford University
Dr. Tabassum Kennedy, University of Wisconsin
Dr. Carolyn Meltzer, University of Southern California
Dr. Christine Menias, Mayo Clinic Arizona
Dr. Theresa McLoud, Massachusetts General Hospital
Dr. Vincent Mellnick, Mallinckrodt Institute of Radiology
Dr. Neil Rofsky, UT Southwestern Medical Center
Dr. Mary Scanlon, University of Pennsylvania
Dr. Jessica Stewart, University of California, Los Angeles
Dr. Stefan Tigges, Emory University
Dr. Emma Webb, University of California, San Francisco
Dr. Ben White, Baylor University Medical Center
Dr. Carina Yang, University of Chicago
Dr. Judy Yee, Albert Einstein College of Medicine
Most Effective Radiologic Sciences Educator
Meena Amlani, EdD, British Columbia Institute of Technology
Catherine Bloor, Cuyahoga Community College
Michael Cannavo, Image Management Consultants
Daniel DeMaio, University of Hartford
Maureen Firth, Passaic County Community College
Brad Johnson, GateWay Community College
Chalonda Jones-Thomas, Thomas Institute of Health Professions
Louise Miller, Mammography Educators
Lior Molvin, Duke University
Kristi Moore, PhD, University of Mississippi Medical Center
Quentin Moore, PhD, Mercy College of Ohio
Lauren Noble, EdD, University of North Carolina
Most Effective Radiology Administrator/Manager
Maxwell Baptiste, NYU Langone Health
Ernesto Berumen, University of Texas Southwestern Medical Center
Ron Collister, University Hospitals of Cleveland
Michelle Dossa, PhD, University Hospitals Elyria Medical Center
Camille Endres, University of Washington
Stacey England, University of Utah Hospital
Gina Greenwood, University of Wisconsin
Ricu Lantaya, University of Maryland Medical Center
Andrew Menard, JD, Brigham and Women's Hospital
Katherine Pizer, University of Chicago
Serage Rahima, University of Southern California
Patricia Richards, Mayo Clinic
Tisha Stewart, Gateway Diagnostic Imaging
Dan Wassilchalk, University of Virginia
Sandria Wong, University of California, San Francisco
Best Radiologist Training Program
Baylor College of Medicine, Houston TX
Beth Israel Deaconess Medical Center, Boston, MA
Brigham and Women's Hospital, Boston, MA
Cleveland Clinic Foundation, Cleveland, OH
Columbia University, New York City
Dartmouth-Hitchcock Health, Lebanon, NH
Duke University, Durham, NC
Emory University, Atlanta, GA
Indiana University, Indianapolis, IN
Johns Hopkins University, Baltimore, MD
Mallinckrodt Institute of Radiology, St. Louis, MO
Massachusetts General Hospital, Boston, MA
Mayo Clinic, Rochester, MN
Mayo Clinic, Scottsdale, AZ
Medical University of South Carolina, Charleston, SC
New York University, New York City
NewYork-Presbyterian Hospital/Weill Cornell Medicine, New York City
Northwestern University, Chicago, IL
Stanford University, Stanford, CA
Thomas Jefferson University, Philadelphia, PA
University of California, Los Angeles, Los Angeles, CA
University of California, San Francisco, San Francisco, CA
University of Maryland, Baltimore, MD
University of Michigan, Ann Arbor, MI
University of Pennsylvania, Philadelphia, PA
University of Pittsburgh, Pittsburgh, PA
University of Texas Health Science Center Houston, Houston, TX
University of Texas San Antonio, San Antonio, TX
University of Virginia, Charlottesville, VA
University of Washington, Seattle, WA
University of Wisconsin-Madison, Madison, WI
Wake Forest University, Winston-Salem, NC
Yale University, New Haven, CT
Best Radiologic Sciences Program
Albert Einstein Medical Center, Philadelphia, PA
Arkansas State University, Jonesboro, AR
Ball State University, Muncie, IN
Bellevue College, Bellevue, WA
Duke University, Durham, NC
Emory University, Atlanta, GA
Kent State University, Salem, OH
Johns Hopkins University, Baltimore, MD
Johnston Community College, Smithfield, NC
Medical University of South Carolina, Charleston, SC
Northwestern State University, Natchitoches, LA
Thomas Jefferson University, Philadelphia, PA
University of Mississippi, Jackson, MS
University of Hartford, West Hartford, CT
University of Nevada, Las Vegas, Las Vegas, NV
University of North Carolina, Chapel Hill, NC
University of South Alabama, Mobile, AL
University of Wisconsin-Madison, Madison, WI
University of Texas Southwestern, Dallas, TX
Weber State University, Ogden, UT
Most Significant News Event in Radiology
Approval of Lu-177 PSMA-617 (Pluvicto) for prostate cancer theranostics
COVID-19 pandemic and its effect on radiology
First photon-counting CT scanner gets clearance for the U.S. market
GE to spin off healthcare division into separate company
Growth of artificial intelligence and machine learning in radiology
RSNA returns as in-person conference in 2021
Shortage of iodinated contrast media develops due to supply-chain disruptions
Shortage in radiologic technologist staff
Biggest Threat to Radiology
Burnout of physicians
Commoditization of radiology services
Corporate takeovers of independent radiology practices
COVID-19 pandemic and its effect on radiology volumes
Decline in Medicare and third-party reimbursement rates
Encroachment of advanced practice staff on radiologist tasks
Increased use of medical imaging by physicians in other specialties (turf battles)
Liquid biopsy diagnostic tests for cancer
Overutilization of medical imaging
Predatory academic journals
Shortage of iodinated contrast media
Use of artificial intelligence to interpret medical images
Hottest Clinical Procedure
7-tesla MRI
3D printing of internal anatomical structures
CT lung cancer screening
Dark-field x-ray
Digital breast tomosynthesis
Dual-energy CT
PET/MRI
PET with gallium-68 PSMA-11 radiopharmaceutical
PET for Alzheimer's disease
Photon-counting CT
Portable MRI
Total-body PET/CT
Ultrasound elastography
Scientific Paper of the Year
18F-FDG PET/CT and novel molecular imaging for directing immunotherapy in cancer. Hughes D et al, Radiology, June 28, 2022. To learn more about this paper, click here.
Best New Radiology Device
(click on the links below to learn more about each device)
Aura 10 PET/CT specimen imaging, Xeos
Definium 656 HD x-ray system, GE Healthcare
EMVision portable brain scanner, EMVision
FDR Cross portable fluoroscopy/digital radiography system, Fujifilm Healthcare Americas
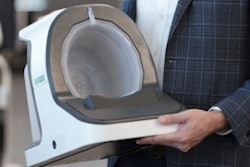
Imagio breast imaging optoacoustic ultrasound system, Seno Medical Instruments
IzoView breast CT scanner, Izotropic
Magnifico Open MRI scanner, Esaote
mKDR Xpress mobile x-ray, Konica Minolta Healthcare Americas
MobileDaRt Evolution MX8 Version V mobile x-ray system, Shimadzu Medical Systems
MR 7700 3-tesla MRI scanner, Philips
MRI Room Alert System, Sound Imaging
Naeotom Alpha photon-counting CT scanner, Siemens Healthineers
OmniTom Elite mobile CT scanner with photon-counting detectors, Samsung NeuroLogica
Radialis small-footprint PET system, Radialis
Rover mobile x-ray system, Micro-X
SoftVue 3D whole-breast ultrasound tomography system, Delphinus Medical Technologies
SpectralDR digital radiography detector, KA Imaging
Tron mobile CT/fluoroscopy system, Xoran
Valory digital radiography system, Agfa HealthCare
Vantage Fortian MRI scanner, Canon Medical Systems
Vivix-S F series digital radiography panel, Vieworks
X1 radiation therapy system, RefleXion Medical
Best New Radiology Software
(click on the links below to learn more about each software application)
Agamon Coordinate Platform, Agamon
AI OS operating system, Aidoc
AI Technology for AD Progression Prediction MRI software, Fujifilm
Auto Scan Assist MRI software, Canon Medical Systems
BioTrace IO ablation therapy guidance software, TechsoMed
BrainScan.AI software, BrainScan.ai
BU-CAD breast ultrasound CAD software, TaiHao Medical
Carbon Space user interface, Siemens Healthineers
ClariPulmo AI-powered 3D reporting software, ClariPi
Continuity follow-up tracking software, Rad AI
Curie|Endex DICOM standardization software, Enlitic
Education Portal teaching software, Sectra
Enterprise CXR software, Annalise.ai
Extracellular Volume Fraction with CT (ECVct) software, Ziosoft
Flywheel Exchange data-sharing software, Flywheel
IB Clinic - Container edition, ImagingBiometrics
Intuition version 4.6 advanced visualization software, TeraRecon
Koios DS ultrasound AI software, Koios Medical
Liver ASSIST Virtual Parenchyma, GE Healthcare
Muscle Assessment Score (MAsS) Scan software, AMRA Medical
Preterm AI software, Ultrasound AI
qXR-BT software for guiding breathing tube placement on x-ray, Qure.ai
Radloop incidental findings software, Radloop
Report Reader patient education software, PocketHealth
ScanLabMR MRI simulation software, ScanLabMR
Search Lung CT software, Contextflow
SieVRt virtual reality (VR) radiology software, Luxsonic
Smart Noise Cancellation (SNC) dose-reduction capability, Carestream Health
SmartSpeed MRI acceleration software, Philips
Strategically Acquired Gradient Echo (STAGE) MRI image processing software, SpinTech MRI
Stratus Imaging PACS software, Change Healthcare
Visage 7 Video Reports reporting software, Visage Imaging
Viz SDH AI-based software for subdural hemorrhage (SDH), Viz.ai
Volpara Analytics v3.0 software, Volpara Health
Best New Radiology Vendor
16 Bit. Learn more about this company by clicking here.
Agamon. Learn more about this company by clicking here.
Annalise.ai. Learn more about this company by clicking here.
Avatar Medical. Learn more about this company by clicking here.
Centerline Biomedical. Learn more about this company by clicking here.
ClariPi. Learn more about this company by clicking here.
EMVision. Learn more about this company by clicking here.
Ferrum Health. Learn more about this company by clicking here.
Human Bytes. Learn more about this company by clicking here.
InformAI. Learn more about this company by clicking here.
Intradys. Learn more about this company by clicking here.
Luxsonic. Learn more about this company by clicking here.
Radialis. Learn more about this company by clicking here.
StreamlineMD. Learn more about this company by clicking here.
Synapsica. Learn more about this company by clicking here.
Best Educational Mobile App
CTisus iQuiz, Dr. Elliot Fishman (iOS)
EducationXR, Heizenrader (iOS, Android)
Horos Mobile, iCat Solutions (iOS)
IMAIOS e-Anatomy, IMAIOS (iOS, Android)
iRadTech, Ballinger and Bruckner (iOS, Android)
MagnetVision, Dr. Emanuel Kanal (iOS)
MSK Radiology 4 U, Philip Abraham (iOS, Android)
Radiology Core: Physics Plus, Ca Nguyen (iOS, Android)
RadDiscord, a server on Discord, Dr. Grace Zhu (iOS, Android) (note: these links are for the Discord app)
Radiology Assistant 2.0, BestApps (iOS)
Radiology Measurements, Xaktis (iOS, Android)
Radiology Rounds, Neuroglia Health (iOS, Android)
RITE Advantage, RITE Advantage (Android)