A new study from Japan has found significant differences in the ways that five different commercial software packages assess abnormal brain regions on CT perfusion scans. The variances could lead to errors in patient management, according to the researchers.
Although the quantitative nature of CT perfusion imaging is one of its key strengths, perfusion imaging results have been found to vary based on differences in scan parameters including mAs, kVp, and temporal resolution. Variations have also been reported in postprocessing steps, wrote Dr. Kohsuke Kudo, Ph.D., from Iwate Medical University in Morioka, and colleagues in the January issue of Radiology.
"However, previous studies have not focused on the differences among commercial software that use different algorithms," they wrote. "The differences among software can be important when interpreting perfusion abnormalities, comparing results among studies, and adopting CT perfusion imaging as a criterion for patient selection in multicenter trials" (Radiology, January 2010, Vol. 254:1, pp. 200-209).
The study evaluated variability, both quantitative and qualitative, among five different commercially available software packages from different manufacturers, using identical CT source data for all of the software.
CT perfusion images from 10 stroke patients were each examined using five different commercial software packages. Each was based on a different algorithm, defined as singular-value decomposition (SVD), maximum slope (MS), inverse filter (IF), and box modulation transfer function (bMTF).
As a reference for the other software packages, the same CT perfusion data were also analyzed by using a free software program, Perfusion Mismatch Analyzer (PMA), that used both standard (sSVD) and block-circulant (bSVD) SVD methods.
CT perfusion software versions and analysis algorithms
|
Once the 10 datasets were processed using all five programs, areas showing abnormalities in cerebral blood flow (CBF), mean transit time (MTT), and cerebral blood volume (CBV) were compared with each other and with the final infarct areas.
CBF, CBV, and MTTs of the final infarct area were measured by superimposing the region of interest of the final infarct area over the perfusion maps generated by each software application. Kudo and colleagues also examined differences among the ratios of quantitative values in the final infarct areas and those in the unaffected side of the brain.
The results showed "significant differences" in the way the different commercial software packages calculated areas of CBF, MTT/time to peak (TTP), and CBV abnormalities compared to final infarct size. Similar differences were also seen in the Perfusion Mismatch Analyzer results, which used both standard and block-circulant SVD methods. Finally, infarct size, based on one-way repeated-measures analysis of variance on ranks was significantly different among the software packages (p < 0.0001 for all), the group reported.
"Images that showed a decrease in CBF measured by using SVD (software A, C) and bMTF (software E) methods correlated well with those measured by using sSVD methods with PMA and were significantly larger than the final infarct size," the authors wrote. "However, the abnormal areas measured by using IF (software B) and MS (software D) methods correlated with those measured by using bSVD methods as well as the final infarct size. There were significant correlations between each pair of images among SVD, bMTF, and sSVD methods and between each pair of images among IF, MS, bMTF, and bSVD methods."
 |
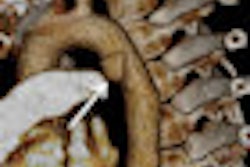
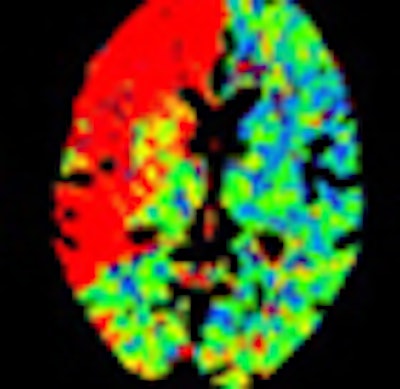
| Perfusion maps generated from identical source data by using different software. Unenhanced CT images (above) and perfusion maps (below) in 73-year-old man with right middle cerebral artery occlusion. CBF, CBV, and MTT/TTP maps generated with all software and by using sSVD and bSVD methods are displayed with same color lookup table, automatic color scale determination, and vascular pixel elimination. On unenhanced scan at admission (above, left), faint hypodense areas in right frontal operculum and basal ganglia are noted and final infarct area is identified on follow-up unenhanced scan (above, right). Decrease in CBF area measured with sSVD is much larger than that measured with bSVD, which is comparable with final infarct area. Software A, C, and E show almost same CBF changes as sSVD, while software B and D show almost same changes as bSVD. Abnormal MTT/TTP areas in sSVD and software A, C, D, and E were apparently larger than those in bSVD, software B, and final infarct area. Note that an erroneous MTT/TTP decrease in software A, B, D, and bSVD is seen in area of significant CBV decrease. Areas with CBV decrease are almost the same among all software. All images republished with permission of the Radiological Society of North America from Radiology, January 2010, Vol. 254:1, pp. 200-209. |
 |
Only weak correlations were found between the pairs among the sSVD and bSVD groups. Areas with MTT/TTP abnormalities were also markedly different among the different software packages: Abnormal TTP and MTT areas measured by using SVD, bMTF, and sSVD were significantly larger than the final infarct size and showed significant correlations between each pair. However, areas with MTT abnormalities measured by using IF and bSVD methods had a significant correlation and corresponded well with the final infarct size measurements.
Areas with CBF or MTT/TTP abnormalities varied substantially among the software packages. However, areas with CBF decrease or MTT increase measured with SVD and bMTF algorithms were similar to those measured with sSVD and corresponded well with each other, while those measured with IF and MS were similar to those measured with bSVD with excellent correlation.
"Hence, the software appear to be divided in two groups: those that appear equivalent to sSVD (group 1; software A, C, and E), and those that appear equivalent to bSVD (group 2; software B and D)," they wrote. "These results suggest that CBF and MTT maps can provide similar information concerning perfusion abnormalities when the software belong to the same group, but not when in different groups."
Predicting the infarct core size is key to identifying tissue at risk for management of acute stroke, they wrote. In previous reports, abnormal CBF decreases were well-correlated with final infarct size for delay-insensitive MS method by using CT perfusion imaging and delay-corrected SVD at MRI perfusion -- and overestimated using SVD with both CT and MR perfusion imaging.
No patients in the study showed recanalization of occluded vessels, the authors noted. "Abnormal CBF/MTT areas in the delay-sensitive software led to overestimation of the final infarct size, while CBF/MTT areas in the delay-insensitive software corresponded well," Kudo et al wrote. "Therefore, delay-insensitive algorithms are preferable for estimating the final infarct size."
Evaluating ischemic severity is also important for assessing acute ischemic stroke. For this measure, the researchers found that relative CBF (rCBF) values of the final infarct areas in the delay-sensitive software were significantly smaller than in the delay-insensitive software. Relative MTTs (rMTTs) in delay-sensitive software were also larger than those in the delay-insensitive software, in line with previous reports.
Delay-insensitive MS underestimated rCBF, and delay-sensitive SVD methods showed larger rMTTs than sSVD, they wrote. "Hence, rCBF and rMTTs can be affected not only by the tracer-delay effect but also by other factors during postprocessing, such as the denoising filter, curve fitting, and regularization of deconvolution."
Two key limitations of the study were the small sample size of just 10 patients, and the fact that newer versions of the software are now available that can deal with tracer delay. These versions should be evaluated on simple datasets made with phantoms, they wrote.
Overestimation of abnormalities in CBF and MTT, presumably owing to the tracer-delay effect, occurred in software utilizing delay-sensitive algorithms, the group concluded. "These variations among software should be minimized to improve the reliability of CT perfusion imaging analyses," the researchers wrote.
By Eric Barnes
AuntMinnie.com staff writer
January 22, 2010
Related Reading
Clinical exam more predictive than postsurgical head CT, December 21, 2009
Ultrasound signals of asymptomatic emboli predict stroke risk, December 7, 2009
New cerebral microbleeds can develop early after stroke, December 7, 2009
Stroke sonothrombolysis speeds clot breakup but raises risk of hemorrhage, September 28, 2009
New neuroimaging potential seen in 320-row CT, October 20, 2008
Copyright © 2010 AuntMinnie.com