Fluid and fecal tagging is a proven method of distinguishing polyps from residual materials in virtual colonoscopy; it works so well it's fast becoming the standard of care. But there's a well-known downside: the tendency of tagged, highly attenuated regions to "bleed" into adjacent structures on CT images -- an effect not unlike seeing a halo when staring at a bright light.
Researchers from Boston are addressing the problem with a method of electronically subtracting the spillover attenuation without otherwise affecting the images. More sophisticated and effective than previous threshold-based schemes, the new method will be incorporated as a functional component of virtual colonoscopy computer-aided detection (CAD) systems.
In a preliminary study presented at the Computer Assisted Radiology and Surgery (SCAR) meeting in Osaka, Japan, the group's structure-based cleansing method significantly improved the accuracy of CAD for detecting colonic polyps.
"The problem with fecal tagging is that high-density tagging may increase artificially the absolute density of neighboring soft tissues -- we call this pseudoenhancement (PEH)," said Janne Näppi, Ph.D., from Massachusetts General Hospital in Boston. "This is a problem in CAD because based on CT value alone we can no longer say the voxel represents tagged soft-tissue materials."
For Näppi and his colleagues Wenli Cai, Ph.D.; Dr. Michael Zalis; Gordon Harris, Ph.D.; and Hiro Yoshida, Ph.D., from Massachusetts General Hospital and Harvard Medical School in Boston, the study is the latest in a string of research projects dealing with CAD and electronic cleansing issues in virtual colonoscopy data.
Another key problem with pseudoenhancement is that its effects vary depending on the amount of tagging material present and the radiodensity of tagged regions of the colon. "It can have different effects between different colon preps, different patients, and even between different regions of same colon," Näppi said.
Because CAD schemes use CT attenuation to differentiate polyps from tagged materials, pseudoenhancement can distort the appearance of polyps and reduce CAD's sensitivity, especially for smaller lesions.
"Pseudoenhancement can also reduce specificity, because distorted polyps may look similar to false positives, and CT-attenuation features, which are quite useful in untagged studies, may now produce unstable results," Näppi said.
The method normalizes the attenuation of virtual colonoscopy images via local correction of attenuation without affecting the underlying attenuation of the CT data.
"After this correction, all soft-tissue voxels can be expected to have normal attenuation of less than 100 HU, while voxels with higher CT attenuation can be assumed to represent tagged residual materials," Näppi said.
Due to the pseudoenhancement effects of high-attenuating structures, threshold-based cleansing methods used in previous applications often generate polyp images that are distorted and appear smaller than they are. Structure-based cleansing recovers the soft-tissue structures covered partially or completely in tagged materials without adding artifacts, he said.
"To estimate the effect in the first step of our method we modeled the initial pseudoenhancement energy of voxel 'Q' by subtracting the CT attenuation of the voxel with the resulting Q with a variable that's 100 HU or higher," he said.
This value is used to calculate the pseudoenhancement energy from voxel Q, which is distributed in Gaussian distribution around "Q" with Sigma 1, he said. As a result, each voxel in the Q neighborhood receives residual energy, and the total residual energy received by the voxels adjacent to the enhanced structures are gathered from the running voxels and calculated iteratively, Näppi said.
"At each step we continue by redistributing the residual energy that was redistributed by the previous step, which is then redistributed in the next step as a Gaussian spread with Sigma 2," he said. "And all these distributed energies are gathered by these neighborhood voxels."
Finally the CT values are normalized over the entire volume by subtracting some of the residual pseudoenhancement energies from the residual CT attenuation, Näppi said in his presentation.
Testing
The method was calibrated on a human colon phantom including 21 polyps and 11 haustral folds. The phantom was scanned without and with tagged materials of various densities at 3.5-mm collimation, 1.6-mm reconstruction interval, 50 mAs, and 140 kVp. The untagged images served as the reference standard, while the others were subjected to the correction method.
The normalization scheme was also tested on the group's fecal-tagging CAD application using 26 polyp cases of patients who were prepped with a cathartic magnesium citrate solution and fecal tagging prior to virtual colonoscopy at 2.5-mm collimation, 1.25-mm reconstruction, 70 mAs, and 140 kVp in supine and prone positions.
Forty cathartically cleansed untagged datasets with polyps were used as control datasets. The application of the normalization method reduced false-positives significantly at comparable leave-one-patient-out detection sensitivity levels.
 |
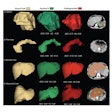
| Above and below: Images from human colon phantom demonstrate correction of CT attenuation values with the normalization method. Above, simulated polyps covered by tagged fluid, shown with lung CT display window (-1000 to 600 HU). Below, soft-tissue CT display window (-200 to 200 HU) shows distortion of the CT values of polyps by pseudoenhancement. Bottom, the result of CT-value correction demonstrates minimized distortion. All images courtesy of Jänne Näppi, Ph.D. |
 |
 |
Soft-tissue regions of interest containing the submerged polyps and folds were extracted semiautomatically and registered via a ridged registration method. The mean square error (MSE) of the difference ROI was used to measure the quality of cleansing.
"In an analysis of 10 ROIs including 10 submerged polyps greater than 8 mm, the average MSE in the normalization method was 2,268 HU, whereas that (threshold-based) cleansing was 6,355 HU; the t test showed that the difference was statistically significant," the group wrote.
 |
| Above and below: Images from a clinical case demonstrate the density mapping method with CAD. Top, polyp covered by tagging material. Below, polyp is revealed after CT-value correction and density mapping. Third image from top, CAD detection is overlaid on the original image. Bottom, CAD detection overlaid on the corrected and mapped image. |
 |
 |
 |
The method was also tested on the group's CAD scheme, using 41 cases of patients who were prepped with a noncathartic magnesium citrate solution and fecal tagging prior to virtual colonoscopy at 2.5-mm collimation, 1.25-mm reconstruction, 70 mAs, and 140 kVp. Once again the S-cleansing method far outperformed threshold-based cleansing, reducing false-positives significantly.
 |
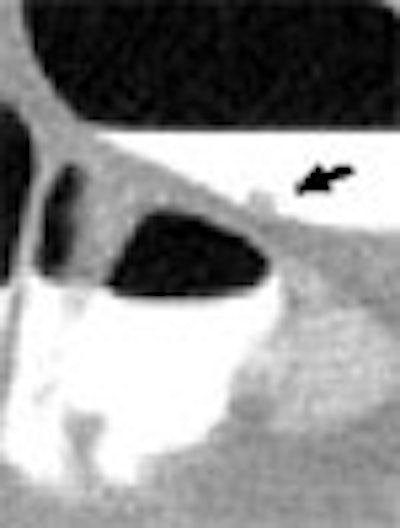
| Above and below: Images from a second clinical case demonstrate adaptive correction with CAD. Top, lesion (arrow) covered by tagged fluid, seen with lung display window. Below, soft-tissue display window shows distortion of the polyp. Third from top, CT-value correction reduces polyp distortion. Bottom, CAD detection overlaid on lung display window. |
 |
 |
 |
Dr. Abraham Dachman from the University of Chicago in Illinois and Dr. Richard Choi from Walter Reed Army Medical Center in Washington, DC, provided the clinical cases for the project, Näppi said.
"At a 92% polyp detection sensitivity without the normalization method, we had two false positives per scan, whereas with the method we had 0.6 false-positives per scan," Näppi said. The untagged dataset, submitted to the cleansing method as a control dataset, showed no changes as expected, he said.
"We developed an adaptive normalization method for minimization of pseudoenhancement in (VC) data, we optimized it in a colon phantom, and we used this as a step in our CAD," Näppi concluded. "What's also nice with this method -- we can use it retrospectively with any (VC) data," he added. "So it apparently has promise. Based on our results, the method yielded up to 70% false-positive reduction in our fecal tagged (VC) cases."
By Eric Barnes
AuntMinnie.com staff writer
August 8, 2006
Related Reading
2D primary reading plus CAD has an edge in VC study, July 11, 2006
Best preps are tailored to VC reading method, November 16, 2005
CAD struggles through tagged, subtracted VC data, May 18, 2005
Iodine tagging regimen yields best VC results, January 27, 2005
Copyright © 2006 AuntMinnie.com

