
The U.S. Food and Drug Administration (FDA) cleared two new artificial intelligence (AI)-based MRI interpretation applications from Siemens Healthineers.
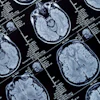
The company's AI-Rad Companion Brain MR for Morphometry Analysis is an algorithm that automatically measures volumetric changes in the brain. Brain volumetry involves measuring the volume of gray matter, white matter, and cerebrospinal fluid in the brain, and it previously was performed manually or semiautomatically. Lower volume can indicate the presence of Parkinson's or Alzheimer's disease.
Meanwhile, AI-Rad Companion Prostate MR for Biopsy Support segments the prostate on MR images and marks the organ's outer contour in seconds, much faster than manual segmentation.
Radiologists can then mark suspicious regions and send annotated MR images to urologists for fusion with ultrasound images during biopsy procedures.
The software aims to give radiologists more time to focus on the most important tasks during MRI exams.


![Overview of the study design. (A) The fully automated deep learning framework was developed to estimate body composition (BC) (defined as subcutaneous adipose tissue [SAT] in liters; visceral adipose tissue [VAT] in liters; skeletal muscle [SM] in liters; SM fat fraction [SMFF] as a percentage; and intramuscular adipose tissue [IMAT] in deciliters) from MRI. The fully automated framework comprised one model (model 1) to quantify different BC measures (SAT, VAT, SM, SMFF, and IMAT) as three-dimensional (3D) measures from whole-body MRI scans. The second model (model 2) was trained to identify standardized anatomic landmarks along the craniocaudal body axis (z coordinate field), which allowed for subdividing the whole-body measures into different subregions typically examined on clinical routine MRI scans (chest, abdomen, and pelvis). (B) BC was quantified from whole-body MRI in over 66,000 individuals from two large population-based cohort studies, the UK Biobank (UKB) (36,317 individuals) and the German National Cohort (NAKO) (30,291 individuals). Bar graphs show age distribution by sex and cohort. BMI = body mass index. (C) After the performance assessment of the fully automated framework, the change in BC measures, distributions, and profiles across age decades were investigated. Age-, sex-, and height-adjusted body composition reference curves were calculated and made publicly available in a web-based z-score calculator (https://circ-ml.github.io).](https://img.auntminnie.com/mindful/smg/workspaces/default/uploads/2026/05/body-comp.XgAjTfPj1W.jpg?auto=format%2Ccompress&fit=crop&h=112&q=70&w=112)


