Researchers at Brigham and Women's Hospital in Boston have developed a new way to evaluate the coronary arteries, using a method based on the change in contrast opacification along the length of normal versus stenosed coronary arteries.
The researchers found that in normal coronary arteries, contrast opacification is reduced by about 11 HU along every centimeter of the left anterior descending artery (LAD), 12 HU per centimeter along the left circumflex artery (LCX), and 5 HU per centimeter along the right coronary artery (RCA).
In contrast, across the relatively smaller length of a lesion classified as > 20% by CT, much larger changes of greater than 50 HU are observed in contrast opacification. This difference is statistically significant, and to date the results have been reproducible in patients scanned in a single heartbeat with 320-detector-row CT.
"We're talking about the potential of using a drop in opacification across a lesion to give additional information about the lesion," said investigator Dimitris Mitsouras, Ph.D., in a recent interview with AuntMinnie.com.
His co-author Dr. Frank Rybicki, Ph.D., added: "Modern coronary [CT angiography (CTA)] gives a morphology picture of stenosis. That is, current techniques don't give you the level of detail often required to determine the significance of the lesion in an individual patient."
"We're trying to use CT in a way that not only provides information about the stenosis," Mitsouras said. "Does that 50% lesion mean something? Does the patient need a stent, surgery, or medical treatment?"
The additional information could potentially improve the management of patients while reducing the need for additional studies, Mitsouras said.
The technique is made possible by the development of 320-detector-row CT, which provides single-RR evaluation of the entire coronary circulation. Scanning the whole heart in a single beat offers a way to examine a snapshot of iodine opacification within the whole volume of the beating heart as a possible proxy to flow dynamics, Mitsouras said.
In contrast, meaningful comparison of HU values probably is not possible with 64-detector-row scanners, which image the heart volume over several heartbeats as the contrast bolus flows in, he said.
Until now, "no one has been able to look at the normal drop in opacification between the proximal and distal portions of normal coronary arteries for the whole coronary tree in one heartbeat," Mitsouras explained.
While performing prospectively gated coronary CTA on a 320-detector-row CT scanner (AquilionOne, Toshiba America Medical Systems, Tustin, CA), the researchers found what appeared to be gradual and incremental differences in opacification over the length of each coronary artery, and they wondered if variations in opacification might correspond to varying degrees of stenosis in affected coronary arteries.
"We were surprised at the consistency of the differences in normal arteries," Mitsouras said, adding that it would stand to reason that "any differences have to be related to flows and velocities."
The study, originally presented at the 2008 RSNA meeting in Chicago, aimed to develop a robust measurement tool to assess changes in single RR coronary contrast opacification.
In doing so, the researchers hoped to define parameters and normal values for coronary artery opacification that could be used as an adjunct to coronary morphology data currently available for subvolume coronary CTA.
The study included an initial look at opacification in stenosed coronary arteries, a pursuit that will be expanded to far more patients in the next study, Rybicki said.
By modifying software (OsiriX CTA plug-in) originally developed at Linköping University in Linköping, Sweden, the researchers assessed opacification by measuring HU values at small increments along the artery. Measurements obtained every 1 mm included the distance from the ostium, mean HU, lumen area, and vessel cross-section short-axis diameter.
"We analyzed these data externally to see how the contrast changes over, e.g., distance of the vessel," Mitsouras told AuntMinnie.com. "In its simplest form, we generate a graph that shows you contrast opacification on the y-axis and distance along the vessel on the x-axis. Distance can be replaced by other factors that can affect flow, such as cross-sectional lumen area or short-axis diameter."
Mitsouras and Rybicki, along with Dr. Hansel Otero, Dr. Michael Steigner, and colleagues, examined a total of 141 coronary arteries, three in each of 47 patients (mean age, 54 ± 13 years; mean body mass index [BMI], 30 ± 7), using single RR prospectively gated coronary CTA.
Acquisition parameters included 320 x 0.5-mm collimation, 350-msec rotation time, 120 kV, 400-580 mA, and 65% to next R phase window.
Before scanning, each patient was given a beta-blocker in the form of IV metoprolol to achieve a heart rate of 65 bpm or less. Patients also received 80 mL iopamidol 370 mg I/mL as a contrast agent injected at 6 mL/sec and followed by a 40-mL saline flush.
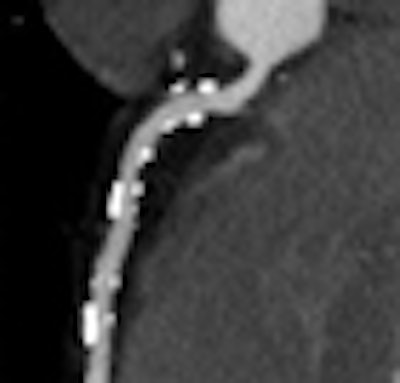
For normal vessels, the team first assessed whether contrast opacification gradients might carry information related to the level of stenosis. To do this, they approximated the continuous change of HU along the vessel by using only two points: in normal arteries, the HU measured at the ostium and where each artery tapered to 2.5 mm in diameter. For diseased vessels, the gradient was similarly approximated by the difference in HU measured immediately proximal and distal to the most proximal lesion.
 |
| The gradient or change in HU along the course of the vessel was defined as the difference in HU at the ostium and the point where each artery tapered to 2.5 mm in diameter. For diseased vessels, the gradient was obtained immediately proximal and distal to the most proximal lesion (above). Measurements were obtained every 1 mm and analyzed to determine the distance from ostium, mean HU, lumen area, and short-axis diameter (below). All images courtesy of Dimitris Mitsouras, Ph.D., and Dr. Frank Rybicki, Ph.D. |
 |
Lesions were classified as < 20%, 20% to 50%, 50% to 70%, and > 70% stenosis. The normal versus diseased approximations to the coronary gradients were compared using a linear model that treated stenoses as categorical data.
According to results in 86/141 normal arteries, the mean proximal and distal attenuation values were 424 HU and 380 HU, respectively (LAD = 436 and 395, LCX = 412 and 367, and RCA = 427 and 382).
The difference (95% confidence interval [CI]) was therefore 44 HU (range, 34-54) for all normal arteries; for the LAD it was 41 HU (range, 24-58), for the LCX it was 46 HU (range, 32-60), and for the RCA it was 44 HU (range, 23-66).
For the 55/141 arteries with lesions, the mean proximal and distal attenuation values were 384 HU and 323 HU, respectively (380 and 310 for LAD, 374 and 316 for LCX, and 402 and 352 for the RCA). The gradient (95% CI) for all arteries with lesions was 61 HU (range, 46-76); 70 HU for LAD (range, 41-98), 59 HU for LCX (range, 35-82), and 50 HU for RCA (range, 23-76).
Therefore, the mean opacification change for coronaries with lesions was 17 HU larger (p = 0.05) than for normal coronaries, the researchers said. Comparing the stenoses subgroups to the normal coronaries, lesions > 70% had a gradient 112 HU higher than normal arteries (p < 0.01), 50%-70% lesions had a gradient 93 HU higher than normal arteries (p < 0.01), 20%-50% lesions had a gradient 37 HU higher than normal arteries (p < 0.01), and lesions < 20% had no statistical difference with normal arteries.
 |
| Results above show statistically significant differences in the gradients of normal vessels versus those with stenoses of 20% or greater. Below, differences of 39 HU are seen in normal or < 20% stenotic arteries. The presence of a stenosis > 20% increases the HU difference by an additional 55 HU. Bottom chart shows significant increases for increasingly higher-grade stenoses. |
 |
 |
For the acquisition protocol used in the study, the change in opacification in normal coronary arteries was approximately 40 HU. Lesions with > 20% stenosis have statistically larger gradients, suggesting that contrast opacification could be used as a tool to evaluate flow-limiting lesions, the researchers concluded.
Given these observed differences, the team further expanded on the two-point approximation by assessing the potential appropriateness of exact gradients by evaluating the quality of a linear fit to the millimeter-by-millimeter change in HU, rather than relying on just the proximal and distal measurements.
They found moderate-to-excellent correlation in every patient for the opacification with respect to short-axis and area gradients. However, HU drop-off with distance was highly nonlinear in a small number of patients, particularly in the RCA, Mitsouras said.
Between patients "there isn't much variability in gradients, something like 10 HU per centimeter," he added.
The differences were also fairly uniform along the length of the arteries. HU-based gradient measurements were statistically nonzero in all normal arteries, with area and short-axis gradients being similar among the vessels in the same patient.
The three exact gradients in normal arteries were also compared amongst the three vessels and correlated with heart rate and BMI.
The use of 320-detector-row CTA enabled the definition and evaluation of contrast opacification differences and gradients in the coronary arteries, and the method shows promise for supplementing the information available from prospectively gated coronary CTA data, the team concluded.
The technique promises the addition of "free information" that already exists in the data -- "something that's beyond the morphology of coronary CTA images alone," Rybicki said.
Area-based gradients, which are independent of both heart rate and BMI, are most appropriate for exact gradient measurements, measuring approximately 10 HU/mm2 in normal coronary arteries.
Limitations of the study include the effects of partial-volume averaging on the HU measurements, Mitsouras said. Most of the patients did not undergo coronary angiography to confirm the diagnosis, and there were only 55 patients with coronary artery stenosis of 20% or greater. Finally, there was no way to verify the output of the customized software package.
The next study will specifically focus on gradients in patients with coronary artery disease.
By Eric Barnes
AuntMinnie.com staff writer
March 6, 2009
Related Reading
320-detector-row CT cuts dose in triple rule-out exams, February 12, 2009
Flexibility of 320-slice CT boosts cardiac imaging options, October 3, 2008
Prospective gating minimizes dose in 320-slice CTA, August 5, 2008
Fourth-generation MDCT scanners do cardiac differently, July 8, 2008
Coronary CTA cuts costs for chest pain care, February 29, 2008
Copyright © 2009 AuntMinnie.com