Tuesday, November 28 | 11:40 a.m.-11:50 a.m. | SSG13-08 | Room S404AB
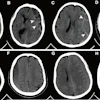
A Dutch team has found that its artificial intelligence (AI) algorithm can automatically perform cardiovascular risk assessment from routine chest CT studies.This research follows up on previous work by a group at University Medical Center Utrecht to develop an automatic, deep learning-based system for quantifying coronary and other arterial calcifications on chest CT scans. That system was originally intended to assess cardiovascular risk on lung screening exams. In this study, the team wanted to see if it could also handle clinical chest CT studies, according to presenter Nikolas Lessmann.
"In contrast to screening scans, many of these patients have acute pulmonary symptoms or other abnormalities that the automatic system needs to cope with," he said.
In testing, the deep-learning algorithm's scoring of coronary, aortic, and cardiac valve calcifications correlated well with manual scoring, according to the researchers.
"We found that the system struggles with extreme cases but overall performs very well," Lessmann said. "This can potentially enable fully automatic assessment of cardiovascular risk in all patients who receive a chest CT scan for whatever indication."
Make this Tuesday morning talk about your own assessment of deep-learning research at RSNA 2017.