Dear AuntMinnie Insider,
If researchers are to successfully localize polyps detected at VC, and match up prone and supine datasets, they'll need to exploit every anatomic landmark they can find. And while the twisted, turning colon isn't exactly a target-rich environment for such efforts, it does offer a few clues.
A couple of years back, for example, a team from the National Institutes of Health successfully mapped and color-coded teniae coli, the longitudinal muscles in the colon that enable peristalsis.
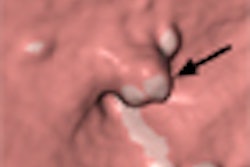
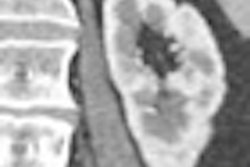
Now researchers from Nagoya, Japan, are tackling latitude with the automated mapping of haustral folds. Their algorithm employs a ridge structure enhancement filter to detect the protrusion of folds from the colonic mucosa, measuring and color coding them. The method not only facilitates the mapping of folds in the colonic lumen, but the precise wall thickness measurements will aid efforts to detect flat polyps in computer-aided detection schemes, according to the team from Nagoya University. Find out how it works in this issue's Insider Exclusive, brought to our subscribers first and foremost.
Efforts to speed up interpretation of 3D virtual colonoscopy data are also high on researchers' wish lists. A U.K. team wondered if using a wider field-of-view -- 140º like a colonoscope -- would speed up interpretation without reducing polyp conspicuity. Get their results by clicking here.
Polyp measurement is another time-consuming task. Dr. Didier Bielen and colleagues aimed to automate measurement -- and risk stratification, too. See how the algorithm performed against human readers by clicking here.
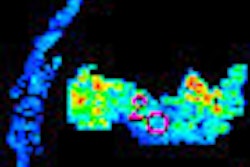
Finally, how does one measure colorectal tumor vascularity in perfusion imaging? Very carefully, says a study in Radiology.
Stay abreast of VC's rapid technical evolution in your Virtual Colonoscopy Digital Community.


![Axial images from unenhanced calcium score cardiac CT (left) and curved planar reformation images from CT angiography (right) show that higher long-term exposure to air pollution is associated with greater coronary artery calcium and more obstructive coronary artery disease (CAD). Top row: Images in a 68-year-old male patient with higher 10-year mean ambient air pollution exposure (7.9 μg/m3 for particulate matter measuring ≤2.5 μm in diameter [PM2.5] and 17.4 parts per billion [ppb] for NO2) with extensive CAD (coronary artery calcium score [CACS] >1,000 and obstructive CAD [≥70% diameter stenosis]). Bottom row: Images in a 57-year-old female patient with lower 10-year mean ambient air pollution exposure (6.3 μg/m3 for PM2.5 and 4.6 ppb for NO2) with no CAD (CACS = 0 and no obstructive stenosis).](https://img.auntminnie.com/mindful/smg/workspaces/default/uploads/2026/06/hanneman.r6SMLzkezo.png?auto=format%2Ccompress&dpr=2&fit=crop&h=167&q=70&w=250)


