It's a good thing that using computer-aided detection (CAD) to find lung nodules at CT has turned out to be worth the effort. Because how radiologists interact with the systems can be mysteriously counterintuitive. New research at California's Stanford University aims to optimize the value of CAD by better understanding radiologists' reactions to it.
Multiple studies over the years have shown that, as Boston radiologist Dr. Jeffrey Mendel recently put it, "we're so much worse at picking up nodules than CAD that it's worth having."
But CAD's demonstrated performance improvements in detecting clinically significant solitary pulmonary nodules (SPN) are bundled with puzzling inconsistencies. And crucial CAD questions remain unanswered.
When CAD is a second reader (still the only demonstrated way to use it effectively), what is the optimal amount of time to spend reading its output? Does the optimal time vary significantly among readers and cases? Are all radiologists helped equally by CAD? If not, what are the differences, and how can that knowledge be applied in clinical practice? Researchers aren't sure.
Yet the questions go to the heart of CAD software design and patient care. In a series of studies on CAD/radiologist interactions, radiologists from Stanford University are exploring new territory. Their most recent project focuses on reader behavior and performance, and it's clear that the results can be applied in some measure to all CAD software/reader interactions, for lung nodule detection and beyond.
At the 2007 International Symposium on Multidetector-Row CT in San Francisco, two Stanford radiologists involved in the research discussed the study and the importance of demystifying CAD to optimize its usefulness.
"Radiologists acting independently do a fairly poor job of detecting important lung nodules and lung cancers," said Dr. Geoffrey Rubin, professor of radiology at Stanford University School of Medicine.
For example, the Japanese Anti-Lung Cancer Association (ALCA) screening trial found that 32% of all lung cancers (mean size 8 mm) were initially missed and diagnosed in retrospect. In a lung volume reduction trial, 55% or nine of 17 lung cancers (mean size 8 mm) were also missed by radiologists reading CT (Radiology, November 2002, Vol. 225:2, pp. 506-510; Annals of Thoracic Surgery, August 1997, Vol. 64:2, pp. 303-306; Radiology, July 1999, Vol. 212:1, pp. 61-66).
"It's not a very pretty story about how well we all do independently," Rubin said. "This really sets the stage for CAD." Of course, much of the difficulty in reliably detecting solitary pulmonary nodules stems from the limitations of reading axial slices in 2D.
"Axial sections give us a limited ability to truly characterize the spherical or circular opacities in the third dimension," he said. Adding that thin-slab maximum intensity projection (MIP) and volume-rendered (VR) images can really help bring the third dimension into play. But having a dedicated platform to find the nodules quickly and automatically (Lung Nodule Evaluation Platform, Stanford) in 3D can also be very effective.
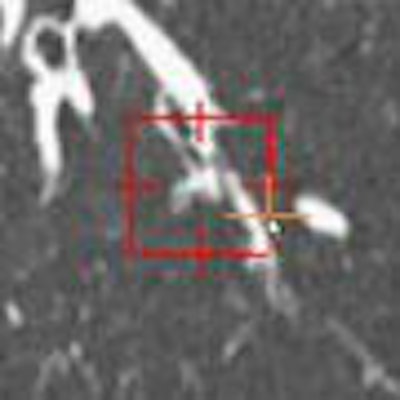
 |
| Small nodules (< 3 mm) depicted on a dedicated lung nodule evaluation software show the utility of reconstructions in lung nodule detection. All images courtesy of Dr. Justus Roos and Dr. Geoffrey Rubin. |
On the other hand, spending too much time interpreting CAD output can be counterproductive, cautioned Stanford radiologist Dr. Justus Roos, who discussed different aspects of the study in his talk.
To understand the benefits of CAD, "we have to understand the challenges of interpreting CT datasets," Roos said. The search for lung nodules at CT suffers from detection errors, interpretation errors, psychological factors such as satisfaction of search errors, fatigue-related errors, and others -- problems that CAD as a second reader can go a long way toward solving, he said.
Still, "with the use of CAD we introduce new challenges, new problems," Roos said. "We have to sacrifice more time for the CAD evaluation, we have to look at a lot of small lung nodules, and we have to look at a new set of false-positive CAD detections."
The Stanford team studied interpretation times, the impact of detecting many small nodules, and the effect of time on reader sensitivity in the CAD setting. They also looked at whether lung CAD affects different readers differently.
"We're trying to determine whether it's really helping or not," Rubin said.
The study examined 20 thin-section MDCT datasets acquired at a slice thickness of 1.25 mm. Three readers were asked to find as many lung nodules as they could, first at a free search, then with the aid of CAD (SNO-CAD, Stanford University). To maximize their time efficiency "and convince them to read the datasets twice," Roos said, CAD detections that the readers had already found during the free search were eliminated from the CAD results. A dedicated lung nodule evaluation package was used to examine the findings.
"Our reference standard was achieved by two readers who looked at all nodules found by readers and CAD," Roos said. The results showed a total of 308 noncalcified nodules, while the analysis was restricted to the 190 noncalcified nodules 3 mm and larger, considered more clinically relevant, that were detected in the searches.
The free search revealed 53% overall sensitivity (range 44% to 59%) with an average of 1.15 false positives per patient. Using free search plus CAD increased the sensitivity to 69% (range 60% to 82%) overall, while increasing overall false positives to 1.45 per patient, Roos said. The mean reading time was 13.6 minutes per case for all three readers, including a mean of 9.7 minutes at free search and 3.9 minutes at CAD evaluation.
As for reading speed, the observers took from five to 12 seconds to accept each true-positive nodule, and no significant change in interpretation speed was seen over time, although Roos said "we think that toward the end they speed up during evaluation." Unfortunately, they were about equally time-efficient in accepting false positives, but more on that later.
"The good thing about false-positive CAD detections is that the readers were really fast in saying it's either a nodule or not," Roos said.
"The time spent for CAD evaluation will definitely dictate the use of CAD in the future," Roos said. "At Stanford we think that plus or minus two minutes is a reasonable time to look at CAD, as long as we have a similar gain per minute between free search and CAD regarding increase in sensitivity."
As for CAD's abundant harvest of small nodules in the study (118 noncalcified lesions smaller than 3 mm), the researchers were "surprised to see that 39% (24 of 61) of the true-positive CAD candidates were actually rejected by the radiologists," Roos said.
On the positive side, radiologists also rejected up to 99.3% (2,267 of 2,283) of the false-positive nodule candidates CAD produced. Anatomic location made a difference. Forty-three percent of the rejected true-positives were near small vessels, 29% were pleura-based, and 26% were clearly visible as nodules, Roos noted.
Why would radiologists reject true-positive CAD findings? "We think it's the size," Roos said. "Almost half of the rejected true-positive candidates were near the 3-mm cutoff."
 |
| More than half of radiologists' falsely rejected true-positive nodules were 3 mm or smaller. |
A free-response operator characteristic (FROC) curve analysis also showed some unusual findings. When true-positive detections were plotted against reader time evaluating the results, "a knee-like bend toward the end" of the reader review appeared to show that detection of true positives slowed definitively at the end of reading.
"Initially, we thought that the radiologist readers tended toward hyperacceptance of false-positive detections over (the course of) the CAD evaluation," Roos said. But further analysis showed that it wasn't radiologists' ability to discriminate true from false detections that declined.
Rather, the CAD output is based on a numerical score for each nodule, with the highest-scoring nodules produced first. This, the researchers hypothesized, led to a diminishing prevalence of true-positive outputs over time.
"We have a net frontloading of nodules presented to the readers in the early time of evaluation," Roos said. "Toward the end, there's not much left they can choose from to increase their sensitivity."
The researchers tested this assumption using a linear random model based on reader confidence statistics. Sure enough, when true positives were introduced randomly rather than frontloaded, sensitivity over time also became uniform and the FROC "knee" disappeared, Roos explained.
 |
| The researchers found a diminishing number of true-positive nodules over the course of radiologists' time spent reading CAD output (above). The drop did not result from radiologists' overacceptance of false positives over time, as was originally thought, but rather from CAD's diminishing output of true positives over time. Instead the downward trend was attributed to the CAD algorithm's nodule scoring function, which output the most likely true positives first. When true positives were evenly distributed, sensitivity also became uniform over time (below). |
 |
Current CAD studies are more observational than experimental, and there is much left to study with the goal of optimizing CAD's effectiveness, he said.
Different strokes for different readers
The three readers in the study were all faculty radiologists with particular expertise in CT, Rubin said. And the data showed that reader two had a substantially greater benefit from CAD than reader one.
 |
| Incorrect interpretations show wide variety of reader responses to CAD output. |
 |
| The three readers benefited unequally from CAD (above). Reader one achieved the highest sensitivity during the free search, but reader two benefited more from CAD, surpassing reader one in accuracy, yet with twice as many false positives (FPs) as reader one. Reader three increased sensitivity after CAD without increasing false positives (below). |
 |
"Reader one achieved the highest sensitivity on free search, but after CAD was introduced, reader two was the more effective interpreter overall of the data," Rubin explained. But with CAD it's always important to look at the results in the context of false positives, as "sensitivity in and of itself is not relevant unless we understand where we're operating on the ROC curve."
As it turned out, reader two, who garnered the highest sensitivity, also turned in the highest number of false positives at the initial free search -- 2.1 false-positive detections per dataset versus 0.6 for reader one, Rubin said. Thus, reader two's improvement once CAD was introduced came at the expense of twice as many false positives as reader one, whereas reader three was able to improve substantially after CAD without adding any false positives.
The three readers showed similar heterogeneity in their detection of false negatives, he said.
After CAD, the improvement that reader two had in sensitivity was in large part based on the fact that he did a much better job at not rejecting true positives, whereas over half of the true positives shown to readers one and three were outright rejected.
"It's a rather complex dynamic," Rubin said. "We never anticipated when we began evaluating CAD that if you asked a CAD algorithm to show a knowledgeable radiologist a true nodule, that the radiologist would reject it and therefore have a false negative result." The corollary is radiologists' tendency to also accept the false-positive detections that CAD presents, in varying degrees.
Time efficiency is also critical in evaluating CAD's utility, Rubin said. The study revealed substantial variability in the amount of time readers took to use CAD and perform free search.
 |
| Substantial differences were also seen in reader interpretation time. After CAD was introduced, reader two (7.8 minutes) spent almost 50% less time than readers one and three (16.9 and 13.6 minutes, respectively) to interpret the data, yet the slower readers derived less benefit from CAD. |
After CAD was introduced, the best reader (two) spent almost 50% less time than the other two readers, at 7.8 minutes versus 16.9 and 13.6 minutes for readers one and three, respectively. Reader one, who did the best job on free search, also spent the most time on it at 12.3 minutes. Yet readers one and three, who spent the most time on both tasks, derived less benefit.
The extremely complex dynamic does not lend itself to a lot of easy conclusions, Rubin said. "The one thing we can say about lung CAD quite clearly is that when we look at performance of three readers and how their results overlap, using CAD certainly brings people together to perform more consistently."
Before CAD was introduced, 34% of detections were in agreement by all three readers. After CAD was introduced, unanimous agreement rises to 54% of all lesions.
 |
| CAD increased heterogeneity among readers. Before CAD was introduced, 34% of detections were in agreement by all three readers (above). After CAD was introduced, unanimous agreement rose to 54% of all lesions (below). |
 |
"CAD certainly improves radiologists' performance, but very heterogeneously," Rubin concluded. "Performance without CAD does not indicate performance when you add CAD. Radiologists will reject true-positive and accept false-positive CAD detections, and CAD does reduce interpretive variability."
There is much left to learn, he added. New methods aimed at reducing the tendency to dissociate performance with and without CAD need to be developed. Researchers need to learn why radiologists reject true positives and accept false negatives. And the effect of such heterogeneous performance with CAD needs to be evaluated from the standpoint of the patient's health.
"Are we just making up a bunch of lesions that in the end are not going to have an impact? These are all data that have yet to appear in the literature and have yet to be investigated," Rubin said. Radiologists should consider the impact of CAD in clinical practice before endeavoring to use it, he said.
By Eric Barnes
AuntMinnie.com staff writer
September 17, 2007
Related Reading
CAD performs well in lung nodule detection, February 5, 2007
Guidelines released for diagnostic testing in suspected pulmonary embolism, December 6, 2006
PET, CT CAD scheme differentiates benign from malignant lung nodules, November 28, 2006
Lung CT CAD boosts performance of less experienced radiologists, November 27, 2006
Barriers still hinder lung CAD adoption, August 24, 2006
Copyright © 2007 AuntMinnie.com