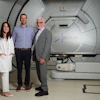
Using magnetoencephalography (MEG) to detect magnetic fields in the brain, researchers at the Children's Hospital of Philadelphia have found that children with autism spectrum disorders (ASDs) process sound and language a fraction of a second slower than children without ASDs.
Their findings, detailed in an article published online January 7 in Autism Research, also show that measuring magnetic signals that mark this delay may become a standardized way to diagnose autism.
Lead author Timothy Roberts, Ph.D., vice chair of radiology research at the hospital, said more work needs to be done before this technique can become a standard tool, but it shows promise that the pattern of delayed brain response may become the first imaging biomarker for autism.
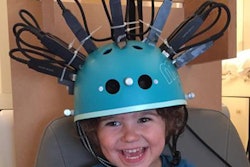
Using MEG and a specially designed helmet, the team presented a series of recorded beeps, vowels, and sentences to children. As the child's brain responded to each sound, noninvasive detectors in the MEG machine analyzed the brain's changing magnetic fields.
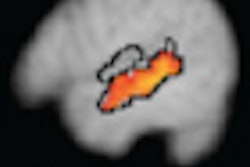
The researchers compared 25 children with ASDs and a mean age of 10 years to 17 age-matched typically developing children. The children with ASDs had an average delay of 11 msec in their brain responses to sounds, compared to the control children. Among the group with ASDs, the delays were similar, whether or not the children had language impairments.
The delayed response suggests that the auditory system may be slower to develop and mature in children with ASDs, according to Roberts. An 11-msec delay is brief, he added, but it means, for instance, that a child with ASD, on hearing the word "elephant," is still processing the "el" sound while other children have moved on. The delays may cascade as a conversation progresses, and the child may lag behind other children.
Related Reading
MEG imaging finds where tinnitus rings in the brain, October 6, 2009
MEG reveals sound processing delays in autistic children, December 2, 2008
Study sheds light on parental instinct, February 28, 2008
Left brain picks desired sounds from cacophony, November 16, 2007
Copyright © 2010 AuntMinnie.com


![A normal mammogram confirmed by three-year radiologic follow-up illustrates reader-marked regions of interest (ROIs) during (A) unaided (round 1) and (B) artificial intelligence (AI)–assisted (round 2) reading. Each colored dot represents an ROI for recall by a human reader. Readers could mark more than one ROI per case, represented by multiple dots of the same color. During AI-assisted reading, the AI system displayed three visible prompts: two with suspicion of malignancy scores of 35% (left mediolateral oblique [L MLO] and craniocaudal [L CC]) and one with a suspicion of malignancy score of 10% (right craniocaudal [R CC]), shown as polygonal overlays. Without AI, six of 10 readers (60%) marked a false-positive ROI. With AI assistance, this fell to two of 10 (20%). R MLO = right mediolateral oblique.](https://img.auntminnie.com/mindful/smg/workspaces/default/uploads/2026/07/2026-07-14-radiology-mammogram-ai-auto-bias.H0bYO8QlWs.jpg?auto=format%2Ccompress&dpr=2&fit=crop&h=167&q=70&w=250)


