Tuesday, November 30 | 10:30 a.m.-10:40 a.m. | SSG13-01 | Room S403A
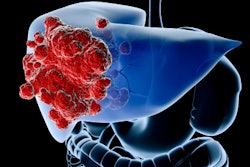
A University of Chicago team will provide an update on its development of computer-aided detection (CAD) software for addressing hepatocellular carcinoma (HCC), according to this paper to be presented on Tuesday morning.While contrast-enhanced hepatic CT has been deployed to detect and characterize HCC, this can be a difficult mission. The density of HCC is often similar to that of normal liver parenchyma and benign tumors, said presenter Jianwu Xu, PhD.
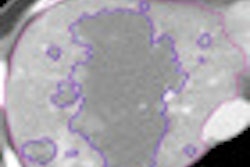
To help with this dilemma, the research group has been developing a CAD scheme for HCC that makes use of both the arterial and portal-venous phases of contrast-enhanced CT.
Confirming their hypothesis, the researchers found that CAD with both of these phases of contrast-enhanced CT images achieved better performance than with only the arterial-phase image, Xu said.
"Moreover, our [CAD] scheme with both arterial and portal-venous phases of CT images achieved a very low false-positive rate with high sensitivity, which paved the way for clinical usage of [CAD] in aiding radiologists in detection of HCCs," Xu told AuntMinnie.com. "The study also suggested that we might further improve the [CAD] performance by combining other phases, such as precontrast and equilibrium phases, of hepatic CT images."