Researchers in New Mexico have put into clinical practice an internally developed software application that automates much of the quality assurance process involved in computed radiography (CR) systems. The software may be able to overcome limitations that have prevented radiology departments from getting a better handle on QA metrics.
Most facilities using CR are already able to perform QA analysis of individual systems, analyzing issues such as how often studies have to be repeated and average dose delivered to patients. Users typically dial into databases derived from their digital x-ray vendor's QA software package.
But a more automated method for QA analysis -- one that might quickly produce department-wide metrics -- has been stymied by various technical factors. For example, each CR vendor uses a different exposure index for representing dose in digital x-ray, and companies don't use consistent parameters and algorithms for determining exposure index of their systems. That can confound sites that operate CR units from different vendors.
At the recent RSNA meeting, researchers from the University of New Mexico (UNM) Hospital in Albuquerque presented a study demonstrating their development of a Web-based software application that enables administrators to automatically perform QA analysis. They say they developed the software, called CR.QA, due to the lack of any commercial applications for cross-platform automated QA analysis.
UNM researchers developed the application using the Perl programming language, with the software running on an Apache Web server, according to medical physicist Phillip Heintz, Ph.D., who presented the study. The application was initially designed to gather data from CR systems manufactured by Fujifilm Medical Systems USA (Stamford, CT) because UNM operates 25 QA stations connected to 18 Fuji readers installed in seven different buildings. The institution is staffed by more than 100 x-ray technologists who perform around 5,000 CR procedures a month.
 |
| Screen shot of data collected by CR.QA software. All images courtesy of Phillip Heintz, Ph.D. |
The software downloads data from each CR reader connected to the hospital's network and stores it in a common computer. The application can perform the following functions:
- Track exposure data by CR site, technologist, location, and exposure index (which can be used as a surrogate data point for measuring patient dose)
- Track retake and reject rates by site, technologist, exposure index, and location
- Create separate reports for digital mammography exams
One challenge, Heintz said, was that UNM had to download QA data nightly, as the hospital's systems administrators frequently reformat computer drives, resulting in data loss. The researchers also realized that digital images aren't necessarily connected with the technologist who acquired the studies -- they fixed this by integrating the data with monthly RIS reports that connect the accession number with individual technologists.
CR.QA went into operation in January 2008 and immediately revealed patterns of high study reject rates at certain sites and among certain technologists. For example, one technologist who supervises students had a particularly high reject rate.
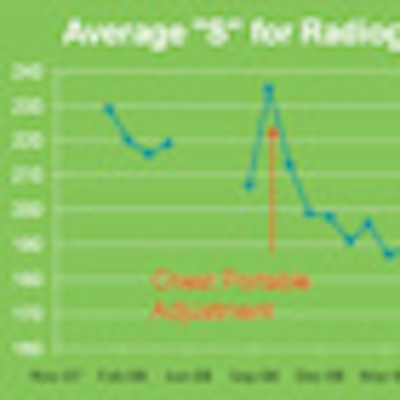
In addition, the software's ability to track exposure indices (in Fuji's case, the sensitivity or S-number) revealed the phenomenon of dose creep -- when average radiation dose slowly creeps higher over time. When technologists were asked to reduce the exposure time of portable chest studies, S-number increased immediately, demonstrating lower radiation doses (S-number has an inverse relationship to radiation dose).
Since that intervention, S-number values have been dropping (and dose rising), representing the propensity of individuals to revert to their previous behavior unless they're closely supervised.
 |
| Output of data derived from CR.QA demonstrate S-numbers rising (and dose falling) immediately after an intervention with technologists to reduce dose in portable chest studies. As time went on, S-numbers began falling (and dose rose) as technologists reverted to their previous behavior. |
In the future, Heintz and colleagues plan to expand CR.QA to support CR units from other manufacturers, as well as digital radiography (DR) systems. He said the group's work has been hampered in some respects by manufacturers who don't allow data to be shared over networks, or don't provide all the necessary data for QA functions. He noted that while some vendors provide software that operates like CR.QA for their own CR systems, none offer applications with support for products from other companies.
The group's efforts may be aided, however, by an initiative under way by the American Association of Physicists in Medicine (AAPM) Task Group 116, which is developing a common exposure index that would be common across different digital detector types and different manufacturers.
By Brian Casey
AuntMinnie.com staff writer
December 23, 2009
Related Reading
Australian software automates data mining of CR dose, September 9, 2009
QA application can bolster DR image quality, consistency, December 22, 2008
Large CR study reveals wide variation in adult and pediatric protocols, September 3, 2008
PACS data-mining tool analyzes CR retake rates, August 5, 2008
PACS data-mining technique tackles CR dose creep, July 30, 2007
Copyright © 2009 AuntMinnie.com