AuntMinnie.com is pleased to present the following case study by radiologic technologist Bernadette Kaufman in which she describes how new information gleaned with MR mammography spared a patient from unnecessary chemotherapy.
Introduction
In March 2006, a 55-year-old patient presented for unilateral left breast mammography as part of a six-month follow-up. She had a history of benign surgical biopsy in 1993 and a two-site stereotactic breast biopsy in 2001. All three biopsies were benign.
Postsurgical scarring was seen centrally in the left breast, a pattern unchanged from 2002. There were no new masses, dominant masses, or stellate lesions. A few benign calcifications were seen in the retroareolar region of the left breast. A focal spot compression view of the left breast was also performed, which failed to show any suspicious findings. Computer-aided detection (DynaCAD, Invivo, Orlando, FL) software was used to review the exam.
Our impression at the time was of a stable left breast with no findings suspicious for malignancy, BI-RADS 3 (probably benign). A six-month follow-up study of both breasts was recommended in order to return the patient to annual bilateral breast surveillance status.
May 2006
Though mammography did not indicate any abnormality, the patient returned to her physician complaining of heat in the left breast and skin thickening. Stereotactic biopsy (Mammotome, Ethicon Endo-Surgery, Cincinnati) was performed on the left breast targeting the retroareolar region. At pathology, infiltrating ductal carcinoma was found. It was grade III/III comedo type with a HER2/neu to D17Z1 ratio of 4.4. A HER2/neu to D17Z1 ratio greater than 2.0 usually indicates HER2/neu gene amplification.
MR mammography was recommended for staging.
 |
| Click here to enlarge image. |
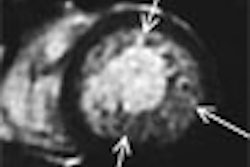
| Upon initial MR imaging following normal mammogram, this 3D image with parametric overlay demonstrated inflammatory breast carcinoma (stage 3C). |
MR mammography protocol
MR imaging on 1.5-tesla unit (Intera, Philips Medical Systems, Bothell, WA ) included T1-weighted axial, T2-weighted axial, STIR axial, and dynamic postcontrast axial acquisition utilizing a 3D technique. A total of five postcontrast acquisitions were obtained over a six-minute time interval. Images were reviewed and postprocessed on a dedicated workstation including generation of 3D maximum intensity projection (MIP) and multiplanar reformatted (MPR) images in the sagittal and coronal planes. Subtractions were also performed. Kinetic analysis was performed with generation of time intensity curves and parametric color maps.
 |
| Click here to enlarge image. |
| The kinetic curve associated with the enhancing region demonstrates type III curve kinetics, highly suggestive of malignancy. |
MR mammo findings
MR imaging showed a markedly asymmetric appearance to the breasts with relatively diffuse skin thickening, and skin and subcutaneous edema through the left breast. The cutaneous layer measured in the range of 1 cm. This was best seen on the precontrast T2-weighted and STIR images. Additional areas of linear edema were scattered throughout the remainder of the left breast. There was a prominent linear focus of edema extending within the retroareolar region of the left breast.
The breasts exhibited a relatively symmetric, modestly dense enhancing fibroglandular pattern.
Within the upper and inner portion of the left breast, a large mass with associated architectural distortion was seen on both T1- and T2-weighted images. This involved the upper and inner aspect of the left breast and extended from the 10 o'clock to 12 o'clock positions. Within the central portion of this area was an irregular enhancing mass measuring approximately 3.5 cm in greatest superior to inferior dimension, 3.5 cm in greatest anterior to posterior dimension, and approximately 2 cm in greatest transverse dimension. Kinetic analysis of the mass demonstrated some heterogeneity of the kinetic profile, but the majority of the mass exhibited significant washout that was highly suspicious for malignancy.
 |
| Click here to enlarge image. |
| A histogram displays the enhancing volume as well as the percentage of the enhancing region that possess type I, II, and III curve characteristics. |
There were additional punctuate enhancing foci anterior, superior, and inferior to the main consulate area of enhancement. These additional foci measured in the range of several millimeters in size.
A linear distribution of similar punctuate enhancing foci also extended anteriorly and laterally from the inferior portion of the mass, and was best seen on the subtracted postcontrast sequence. This linear, duct-like distribution of punctuate enhancing foci extended laterally to the nipple line, superior to the plane of the nipple. The posterior aspect of the mass was located approximately 5 cm anterior to the pectoralis margin. The most anterior and inferior portion of the mass was located at least 5 cm distal to the nipple areolar complex.
 |
| Click here to enlarge image. |
| Following four cycles of chemotherapy, the enhancing region continues to grow. |
An asymmetric pathologically enlarged node within the axillary tail of the left breast was seen, as well as at least two additional asymmetric suspicious nodes low in the left axilla. These prominent enhancing nodes demonstrated significant enhancement and washout. There was no evidence of discrete mass or suspicious area of enhancement throughout the right breast. The right axilla was unremarkable.
Conclusion
The patient underwent four cycles of adriamycin and Cytoxan, which was followed by Taxol and Herceptin. The intent was to continue 24 weeks of chemotherapy as improvements were noted on clinical exam in oncology; however, a therapy-monitoring MRI proved otherwise.
 |
| Click here to enlarge image. |
| The tumor continues to display type III kinetics, despite therapy. |
MR mammography was performed with the same protocol as described above. The areas of enhancement were more pronounced and the curve behavior within the lesion was not improving.
 |
| Click here to enlarge image. |
| A histogram of the enhancing region indicates that the tumor is not responding to chemotherapy and the enhancing volume is increasing. |
Creating scatter plots and histograms of the distribution of enhancement from the pretherapy study compared to the post-therapy study helped revise the treatment plan. Rather than subjecting the patient to 20 more weeks of chemotherapy, she was referred for surgical consultation. Images, curves, and histograms were helpful to modify the course of therapy for this patient.
By Bernadette M. Kaufman, RT (R)(MR)
AuntMinnie.com contributing writer
October 19, 2006
Bernadette Kaufman is product manager of breast MRI at Invivo of Orlando, FL. Kaufman's diagnostic imaging experience spans two decades and crosses multiple modalities, including CT, MRI, mammography, and ultrasound. She has served on a education-focused committees for the American Society of Radiologic Technologists (ASRT) and the International Magnetic Resonance in Medicine's Section for Magnetic Resonance Technologists (SMRT).
Case and images contributed by Dr. Mark Lawton of Wheaton Franciscan Healthcare of Milwaukee.
Related Reading
Invivo gets $500,000 grant, April 11, 2006
MR mammography: Screening tool or diagnostic adjunct? February 9, 2006
Adding MRS to MRI ups specificity for finding breast lesions, December 16, 2005
Breast MRS proves sensitive to all cancers but not in normal breast tissue, November 27, 2005
Copyright © 2006 AuntMinnie.com