Contrast dose and injection rate are critically important in the CT imaging of solid organs, especially the liver and pancreas. Researchers at Duke University in Durham, NC, report that radiologists can minimize contrast dose and optimize enhancement of focal lesions by basing their contrast administration protocols on patients' lean body weight, rather than on total weight.
Why is this so? Because fat doesn't absorb contrast. So, in essence, calculating your contrast protocols based on total body weight can overdose the patient. In a study presented at Stanford's International Symposium on Multidetector-Row CT, Dr. Rendon Nelson showed that basing contrast dose on lean body mass yielded far less variability in solid tumor enhancement -- and what's more, lean body mass can be easily estimated from scout images.
"The real issue is: What is the right amount of contrast material and [injection] rate?" said Nelson, who is a professor of radiology at Duke University School of Medicine. "We have patients who are small and elderly, versus those who are strong and muscular, versus those who are large and heavy."
For arterial-phase applications such as CT angiography, calculating the contrast dose is fairly straightforward: Deliver enough contrast fast enough to opacify the arteries while the x-ray tube is running. But things get more complicated when the venous contrast is part of the protocol, because visualization depends on avoiding the same enhancement levels for lesions and surrounding parenchyma.
Keep in mind that contrast media consist of "small molecular-weight extracellular molecules that start in intravascular space," Nelson said. "They do not cross the cell membrane, but they do leak out of the vessels regularly."
For the first 40 seconds or so after IV injection, the contrast remains in the vessels, then it starts to leak out, he said. Eventually, some contrast molecules begin migrating into the vessels, while others are migrating out, until the processes equalize -- and contrast opacification is said to have reached the equilibrium phase.
But equilibrium is not a good thing for visualizing focal or solid lesions in the liver, where it makes them disappear, or in the pancreas, where lesions are predominantly hypovascular, though equilibrium is less of a problem in renal imaging, he said.
One can base the contrast dose on body weight, which is probably a small improvement over a fixed-dose calculation for all patients. But considering that fat barely enhances, patients with excess adipose tissue have little tissue perfusion of contrast. In that case, "it makes more sense to think about a scheme that uses lean body weight," Nelson said.
Lean body weight best calculates contrast
In a 2007 study led by Nelson's colleague Dr. Lisa Ho, researchers demonstrated that contrast dose can be estimated from lean body weight (Radiology, May 2007, Vol. 243:2, pp. 431-437).
Aiming to evaluate the use of lean body weight as the main determinant of contrast volume and rate, the researchers compared four protocols in a group of 101 patients:
- A standard protocol involving 125 mL of iopamidol injected at 4 mL/sec
- A total body weight (TBW) protocol involving 0.7 g iodine per kg of TBW
- A calculated lean body weight (LBW) protocol involving 0.92 g and 0.86 g iodine per kg of calculated LBW for women and men, respectively
- A measured LBW protocol involving 0.92 g and 0.86 g iodine per kg of measured LBW for women and men, respectively
The injection rate varied based on the total volume of contrast material, and the researchers calculated postcontrast attenuation during the portal venous phase in the liver, portal vein, and aorta for each group. Next, they calculated enhancement variability using Levene's test.
"In the measured lean body weight, we had a narrower range of values for enhancement of the liver, which was our goal," Nelson said.
|
|||||||||||||||
| Results showed significantly less variability in liver attenuation when measured LBW was used to calculate the contrast dose. Data from Radiology, May 2007, Vol. 243:2, pp. 431-437. |
"By excluding highly variable but poorly perfused adipose tissue from calculation of contrast medium dose, the measured LBW protocol may lessen patient-to-patient enhancement variability while maintaining satisfactory hepatic and vascular enhancement," the authors wrote in an abstract.
 |
| Enhancement variability was measured for a standard contrast dose (std), total body weight (TBW), calculated lean body weight (cLBW), and measured lean body weight (mLBW). The results showed that contrast dose calculation based on mLBW had the least variability among the four methods (p = 0.05). All images courtesy of Dr. Rendon Nelson. |
New technique
Unfortunately, the method used to measure lean body weight in those patients was tedious and time-consuming. The researchers sent an electrical impulse from the foot up one leg and down the other, measuring its transit time.
Travel of the electrical current "is diminished by more fat and it's increased by water, so if you have a full bladder, you can actually increase the connectivity," though not by much, Nelson said.
For the next study, Nelson and colleagues were looking for a better technique. "We thought we'd look at single sections -- do something more innovative and see if we can figure out the [LBW] value from the scout view," he said.
They examined images from 25 patients from CT scout views, measuring attenuation in a single slice of the upper abdomen, midabdomen, and pelvis.
"If you plot estimated body weight versus measured body weight ... the best correlation is for the pelvis [r = 0.90]," Nelson said. Correlation for the upper abdomen was much lower, at r = 0.66, and the midabdomen was r = 0.76.
Based on these latest results, the team has begun estimating patients' lean body weight from a single slice of the scout view in the pelvis. The results so far show that equivalent attenuation in heavier patients is achieved with far less contrast dose.
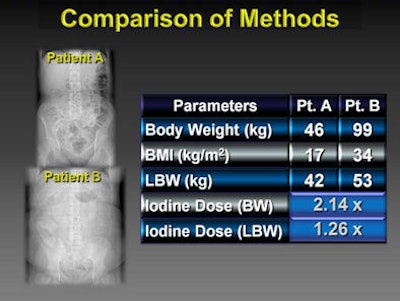
With this calculation, a patient weighing 99 kg requires only 126% of the contrast dose of a patient weighing 46 kg, rather than 214% of the dose, if calculated based on body weight.
If you base the dose on total body weight, "you're overdosing larger patients" with contrast, Nelson said.
 |
| Results of the latest patient study show that based on estimations of lean body mass from a single image slice in the pelvis from the scout view, equivalent liver attenuation can be achieved in the heavier patient with just 1.26x the contrast dose, versus 2.14x the dose if the calculation had been based on total body weight. |
For solid organ imaging, particularly in the liver and pancreas, the research demonstrates that contrast dose based on lean body weight is far less variable than total body weight. Moreover, lean body weight can be easily estimated from a single CT slice in the pelvis, Nelson said.
Dual-energy CT is another way to get higher attenuation in solid organs, he said. "We know that at lower kV, we get more enhancement as we get closer to the k-edge of iodine, and big [x-ray] tubes are now available that can handle this," Nelson said. Therefore, low-kV imaging is another way to improve iodine enhancement.
A liver lesion really stands out at 140 kV versus 80 kV, but the problem is that there's almost twice as much noise, he said. But using one of the new iterative reconstruction techniques rather than filtered back projection can compensate for the additional noise generated by the low kV imaging.
"If you don't like the noise, there's hope on the horizon that iterative reconstruction can eliminate that noise," he said.
By Eric Barnes
AuntMinnie.com staff writer
July 22, 2009
Related Reading
Dual-energy CT characterizes fat-containing pathologies, July 8, 2009
CARS report: Liver segmentation tool allows manual fixes, July 1, 2009
ASIR reconstruction sharpens images, slices abdominal CT dose, May 21, 2009
320-slice coronary CTA permits much lower contrast dose, March 6, 2009
Strategies for reducing 'dose creep' in digital x-ray, April 11, 2007
Copyright © 2009 AuntMinnie.com