Low-dose CT pediatric sinus images are of diagnostic quality, and the effective radiation is comparable to that of standard radiography, according to Belgian researchers.
Standard x-rays lack sensitivity and specificity, and a radiography-based evaluation can either over- or underestimate soft-tissue changes in the paranasal cavities. But the use of CT in evaluating sinuses in children has been limited by the higher radiation dose of CT, the group wrote in the American Journal of Roentgenology (May 2005, Vol. 184:5, pp. 1611-1618).
The researchers are from the department of radiology at Heilig Hart Hospital in Lier and the School of Public Health at the Biostatistical Centre of Katholieke Universiteit Leuven, University Hospital St. Rafael in Leuven, Belgium.
They acquired x-rays for 69 children and low-dose six- or 16-slice CT scans in two phases using different scanning protocols for 125 children. In the second phase, the researchers further reduced the radiation dose, as compared to the first phase, and used faster scan rotation time and higher pitch.
The mean effective dose for the phase 2 CT was 0.0531 mSv, which was comparable to the mean effective dose of 0.0528 mSv for standard radiography. The mean effective dose for the phase 1 CT was 0.096 mSv.
Radiography effective dose
The effective dose for standard x-ray exams of sinuses with anteroposterior and lateral projections was derived from the dose area product (DAP) displayed on the radiography system (Axiom Iconos R200 X-Ray System, Siemens Medical Solutions, Erlangen, Germany). The dose was calculated for different ages of the children using the corresponding coefficients in the British Radiological Protection Board's NRPB-R 279 report, the authors stated.
In some cases, low-pulsed fluoroscopy was done and the dose added to the DAP measurements. As a result, the mean effective dose for the radiographic examinations was 0.0528 mSv (range 0.013-0.205 mSv), higher than the results of other international studies (range 0.02-0.03 mSv), the research group wrote.
CT effective dose
The effective CT dose was derived by correlating the dose length product (DLP) displayed on the system (Emotion 6 and Sensation 16, Siemens Medical Solutions) with the risk-related quantity effective dose, as described in Physics in Medicine and Biology (January 2002, Vol. 47:1, pp. 107-115).
In the first phase, 30 children were scanned using the six-slice CT and 32 using the 16-slice CT. The scan protocol used for the six-slice CT was 80 kV, 6 x 0.5-mm collimation, 1-sec rotation, 1.5 pitch factor, and effective mAs between 20-30 mAs depending on age. And for the 16-slice CT, 80 kV, 16 x 0.75-mm collimation, 1-sec rotation, 0.75 pitch factor, and effective mAs between 37-45 mAs depending on age.
The mean effective dose in phase 1 for six-slice CT was 0.0697 mSv and 0.1218 mSv for 16-slice CT. In phase 2, it was lower at 0.0511 mSv for six-slice CT and 0.0546 mSv for 16-slice CT.
 |
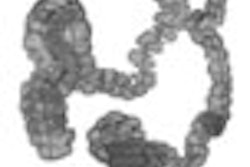
| Normal low-dose CT examination of sinuses of 14-year-old boy (16-slice CT, phase 1; effective dose, 0.11 mSv). 2.5-mm axial image shows normal maxillary and sphenoid sinuses (AJR 2005; 184:1611-1618). |
In phase 2, 27 children were scanned using six-slice CT and 36 using 16-slice CT. The scan rotation was reduced to 0.6 sec per rotation for six-slice CT and 0.5 sec per rotation for 16-slice CT, resulting in lower effective mAs. The pitch factor was also kept higher at 1.5 for 16-slice CT in the second phase, compared to 0.75 in the first phase.
The image reconstructions for both phases were from the raw dataset with a 0.63-mm slice thickness and a 0.3-mm increment for six-slice CT, and a 1-mm slice thickness and a 0.5-mm increment for 16-slice CT, with a sharp (bone) filter algorithm. Consecutive axial and coronal images were obtained, and sagittal images were also reconstructed wherever required.
In phase 2, the mean scanning time was lower at 10.1 sec for six-slice CT and 2.1 sec for 16-slice CT. The mean scan length was 7.25 cm for six-slice CT and 7.90 cm for 16-slice CT.
 |
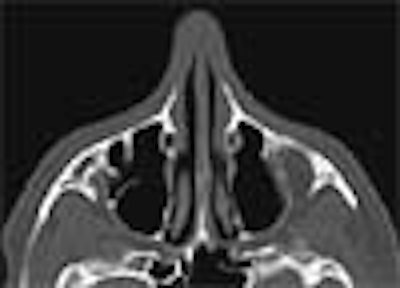
| Three-year-old girl with recurrent upper airway infections, cough, and open-mouth breathing (16-slice CT, phase 2; effective dose, 0.038 mSv). Axial image shows bilateral complete opacification of ethmoid (arrowheads) and sphenoid sinuses (asterisks) with bilateral fluid in middle ear cavities (double asterisks) (AJR 2005; 184:1611-1618). |
"Compared with the 'default' examination protocols for CT examination of the sinuses in children, as proposed by the manufacturer, the dose used in our low-dose protocols, expressed in CTDI vol (volume CT dose index) is five to seven times lower," the researchers wrote.
Comparison of effective dose
Pairwise comparison with Wilcoxon's tests gave a significant difference in effective dose between the phase 1 CT and radiography groups (p < 0.0001), between the CT phase 1 and CT phase 2 groups (p < 0.0001), and between the CT phase 2 and radiography groups (p = 0.048, near threshold level), according to the authors.
"The difference in mean effective dose between the radiography and CT phase 2 groups is 0.0010, with 0.0104 as the upper limit of the 95% one-sided confidence interval, a difference that is negligible," the authors wrote.
Also, while there was a significant difference in effective dose between the radiography group and each CT phase 1 group (p < 0.01 and p < 0.001) and between six-slice CT phase 1 and 16-slice CT phase 2 (p < 0.001), the difference was not significant between the radiography group and each CT phase 2 group (p = 0.22 and 0.06) and between the two CT techniques in phase 2 (p = 0.5).
Statistical analysis with a Kruskal-Wallis test showed a significant difference in effective dose among the radiography, CT phase 1, and CT phase 2 groups (p < 0.0001).
Image quality
The images were independently interpreted by two radiologists and a pediatrician. A scoring system with a score of 1 for each sinusitis sign was used to evaluate interobserver agreement. The paired Wilcoxon's rank test between each pair of reviewers and the Kruskal-Wallis test among the three reviewers showed no statistical difference.
There were 17 negative CT examinations, all of which were scored negative by the reviewers. "With our latest protocols (phase 2), we pushed our CT machines to their lowest possible dose levels but still achieved sufficient image quality to make an accurate diagnosis," the researchers wrote.
By N. Shivapriya
AuntMinnie.com contributing writer
June 9, 2005
Related Reading
Report finds vendors enable excess radiation doses in pediatric CR, DR, February 4, 2005
Use of pediatric head CT growing steadily in emergency departments, May 4, 2004
Constant image-noise standard lowers CT dose in pediatric exams, April 21, 2004
Pediatric CT won't stop growing, but dose can be minimized, May 8, 2003
Low-dose CT touted for oft-needed sinus imaging, February 3, 2002
Copyright © 2005 AuntMinnie.com