Imaging of acute stroke patients at admission accurately predicts follow-up infarct size with both perfusion CT and diffusion-weighted MRI, a new study concludes. Still, only the CT results correlated with severity on the stroke score scales.
The study was undertaken to "measure the extent of cerebral infarction using functional perfusion CT and diffusion-weighted MRI, and second to see if there are possible predictive values from the derived perfusion and diffusion parameters," said Dr. Sotirios Bisdas in a presentation at the 2005 European Congress of Radiology (ECR) in Vienna.
The researchers, from Johann Wolfgang Goethe University Hospital in Frankfurt, Germany, examined 27 acute stroke patients (including 17 patients with dominant hemispheric stroke) with both perfusion CT imaging and MRI diffusion-weighted imaging. All patients underwent noncontrast CT at admission, followed immediately by perfusion CT and an admission MRI study.
The patients' stroke symptoms had begun within six hours of imaging. None had existing neurological disease or stroke.
Standard noncontrast CT at the time of admission and on follow-up control was performed using a LightSpeed QX/i multidetector-row scanner (GE Healthcare, Chalfont St. Giles, U.K.) at 120 kVp, 180 mAs, 512 x 512 image matrix, and 5-mm (posterior fossa/infratentorial) and 10-mm (supratentorial) slice thickness, according to Bisdas.
For the perfusion CT studies, the focus was on two adjacent levels (of 17 total) at the level of the basal nuclei. CT was initiated four seconds after the intravenous rapid infusion (6 mL/sec) of iodinated contrast (Imeron 400, Altana, Konstanz, Germany). Focusing the exam on the basal ganglia in this manner overcomes the limitation of perfusion CT coverage of 1-2 cm per acquisition, Bisdas said.
"Forty-five 10-mm CT sections of continuous (cine) scanning (80 kVp, 90 mAs) were obtained at every adjacent level with a total acquisition time of 45 seconds," he specified in an e-mail to AuntMinnie.com.
MRI was performed using a 1.5-tesla Signa NV/i scanner (GE Healthcare) using a head coil. Admission MRI consisted of a T2-weighted FLAIR (TR 9,000 msec, TE 32 msec, 3 mm/0.6 mm, 5-mm slice thickness), T2-weighted fast-spin echo, and T2-weighted images and diffusion-weighted imaging. Four patients also underwent 3D time-of-flight MRA of the circle of Willis.
The studies were performed at admission and at follow-up a mean of five days later. "None of our patients received thrombolysis," Bisdas said.
On the CT data, the researchers used absolute HU values to measure cerebral blood flow (CBF), and distinguish between infarcted, noninfarcted, and penumbra areas. Biometric maps were generated using commercially available software. For diffusion-weighted MRI exams, areas of acute infarction were delineated on the basis of apparent diffusion coefficient values.
The group also correlated perfusion CT and diffusion-weighted imaging measurements at admission and follow-up (mean five days later) with National Institutes of Health Stroke Scale (NIHSS) scores, also correlating areas of infarction on the follow-up MR and CT studies.
Imaging at presentation showed that the volume of infarcted and ischemic tissue on perfusion CT correlated with the NIHSS score (r = 0.69, p < 0.005 and r = 0.78, p < 0.001), and thus served as a strong predictor of stroke severity, Bisdas said. At the same time, the volume of the diffusion abnormality did not correlate significantly with the NIHSS score (p > 0.5).
 |
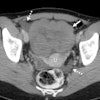
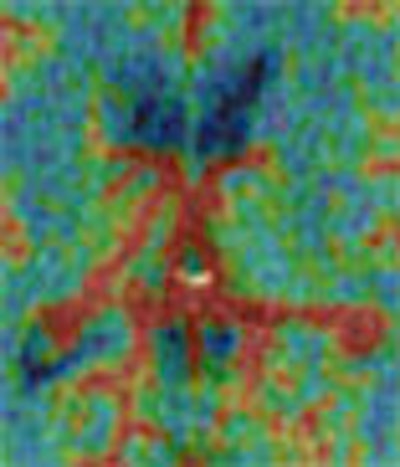
| Top to bottom: Perfusion CT images overlaid on CT source images of a 73-year-old male patient. The patient was scanned 30 minutes after the sudden onset of right hemiparesis with an NIHSS of 20. Above, cerebral blood flow (CBF) map shows a blue-color area of low CBF (range: 0-12 mL/100g/min) in the basal ganglia on the left side, which corresponds to the irreversibly infarcted tissue. Note the peripheral area displayed as green, which corresponds to the penumbra region (range: 12-24 mL/100 g/min). In the image below, cerebral blood volume (CBV) map does not demonstrate a clear delineation of the infarcted region in comparison with the CBF map. In the bottom image, mean transit time (MTT) map shows a slightly larger abnormality than seen on the CBF map. Images courtesy of Dr. Sotirios Bisdas. |
 |
 |
At follow-up imaging (mean five days later), the infarcted tissue volume correlated with the initial perfusion CT with regard to ischemic and infarcted tissue volume (r = 0.63, p < 0.01 and r = 0.71, p < 0.01).
 |
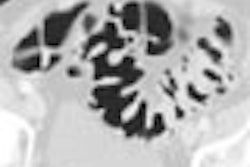
| Diffusion-weighted MRI obtained immediately after perfusion CT demonstrates only a slightly hyperintense region in the left basal ganglia. Images courtesy of Dr. Sotirios Bisdas. |
Significant correlation was also seen between the initial diffusion abnormality volume and the follow-up infarcted tissue (r = 0.74, p < 0.01), he said. However, the follow-up NIHSS score correlated only with the ischemic and infarcted lesion area on perfusion CT (r = 0.70, p = 0.001, r = 0.56, p < 0.05), and not diffusion-weighted MRI.
 |
| Three-dimensional time-of-flight angiography obtained at the time of admission shows an occlusion of the left distal M1. Image courtesy of Dr. Sotirios Bisdas. |
"It is remarkable to see the exact correspondence between the initial perfusion CT study and the follow-up imaging," Bisdas said of an image. "A statistical analysis of our results showed very high correlation coefficients between the infarct core in perfusion CT and diffusion imaging, as well as follow-up imaging."
Perfusion CT and diffusion-weighted MRI at admission in hyperacute stroke patients can accurately predict the short-term follow-up infarct size, Bisdas concluded. But he saw additional value in CT.
"CT may be superior for imaging the acute stroke because it can detect faster and more accurately the ischemic lesion ... (and) deliver quantitative measurements (in contrast to MR perfusion)," he said. Also perfusion CT can be performed rapidly and easily, and integrated into the CT protocol all patients undergo at admission. Whereas MRI is not available 24 hours a day in many institutions, he said.
Regression analysis showed that areas of ischemic and infarcted tissue on perfusion CT correlate with the admission clinical condition and allow the evaluation of clinical prognosis, a potential advantage of perfusion CT over diffusion-weighted MRI, Bisdas said.
 |
| Diffusion-weighted image as well as fluid-attenuated recovery T2-weighted images obtained two days after the initial perfusion CT and MRI demonstrate a hyperintense area close to that on the perfusion CBF and MTT maps and the initial diffusion-weighted imaging. A slight penumbra loss is demonstrated. Images courtesy of Dr. Sotirios Bisdas. |
 |
Among the study's limitations was its small cohort size. Also, the approximate five-day follow-up interval was of limited value, and should be extended to at least 30 days in future investigations, he said.
By Eric Barnes
AuntMinnie.com staff writer
June 1, 2005
Related Reading
Flat position improves blood flow in stroke patients, May 6, 2005
Cerebral blood MRI confirms stroke reperfusion success, April 19, 2005
Postprocessing reveals earliest signs of cerebral infarct on plain CT, March 5, 2005
Immediate CT scanning after stroke cost-effective, November 23, 2004
MR vs. CT? Stroke imaging hinges on more than modality, August 25, 2004
Copyright © 2005 AuntMinnie.com