Poor right ventricular function lies at the heart of many chest troubles, from cardiomegaly and endocarditis to pulmonary hypertension and pulmonary embolism syndromes. Assessing RV function has traditionally required radionuclide ventriculography, echocardiography, or more recently, a dedicated CT scan.
As multislice CT scanners and software continue to improve, however, some researchers are coming to believe that initial workups for patients with unusual chest complaints could be streamlined if RV functional information were acquired as part of a broader CT evaluation of the heart or the chest. Two studies presented at the 2005 European Congress of Radiology (ECR) in Vienna looked at preliminary efforts to create such combined scans.
Researchers from Belgium and France discussed two studies combining RV functional scans with CT angiography and chest scans, respectively. The accuracy and reproducibility were encouraging for evaluating patients with atypical chest pain, particularly as reconstruction and viewing software continue to improve, multislice scanners continue to evolve, and dose-modulation methods grow more sophisticated.
In a study from Cliniques Universitaires Saint-Luc in Brussels, Belgium, Dr. Emmanuel Coche and Dr. R. de Crombrugghe performed a combined RV and thoracic CT exam in 18 patients with suspected acute pulmonary embolism.
"As you know, the prognosis of PE and other lung diseases may be related to right cardiac function," Coche said at this year's ECR meeting. "It would be nice to find a single exploration detecting pulmonary embolism of the parenchyma, and measuring its potential repercussion on cardiac cavities in one acquisition."
At the 2004 ECR meeting, the group demonstrated the feasibility of assessing right and left ventricular function using ECG-gated chest CT in patients with suspected PE. In 10 patients the study produced good correlation with radionuclide planar ventriculography in both left (r = 0.92) and right (r = 0.90) ventricular function (Abstract B-498, ECR 2004).
The 2005 study examined the variability of measurements when assessing the right ventricle surface volumes and function during complete ECG-gated chest CT. Eighteen patients with clinical suspicion of acute PE (nine men, nine women, mean age 69, mean heart rate 69 bmp) were enrolled in the study. Those with irregular pulse, hemodynamic instability, or contraindications for contrast were excluded. Two patients had pulmonary embolism, four had a history of cardiac failure, six had chronic obstructive pulmonary disease, and five had CT signs of pulmonary hypertension.
CT images were acquired using a retrospectively gated 16-slice scanner (MX IDT, Philips Medical Systems, Andover, MA) at 16 x 1.5-mm collimation, 2-mm overlapping reconstruction, 120 kVp, 50 mAs, 0.42-second rotation, with variable pitch depending on heart rate. Acquisition time was 18.7 (13.2-25.3) seconds. Lacking a double contrast injector, the group performed a single-injection phase acquisition using 120 mL of contrast at 3 mL/sec.
Contiguous 2-mm slices were reconstructed every 12.5% of the R-R interval, and 2-mm RV short-axis multiplanar reconstructions were generated on a cardiac workstation. End-systolic and end-diastolic RV volumes were measured by two reviewers (a senior radiologist and a senior clinical scientist). Image quality was subjectively rated excellent, average, or poor.
"We used semiautomated delineation of endocardial borders on the short axis here, in the end-systolic and end-diastolic phases," Coche said. "Cardiac function measurements were performed using Simpson's rules, and ejection fraction by using the usual formula. We assessed inter- and intraobserver variability by using intraclass coefficient correlation (ICC) and its 95% confidence interval, so ICC can be interpreted as the correlation coefficient between repeated measurements. (Results) between 0 and 1 (denote) the perfect method, and superior to point A means adequate reproducibility."
 |
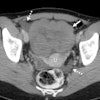
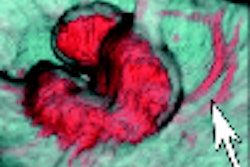
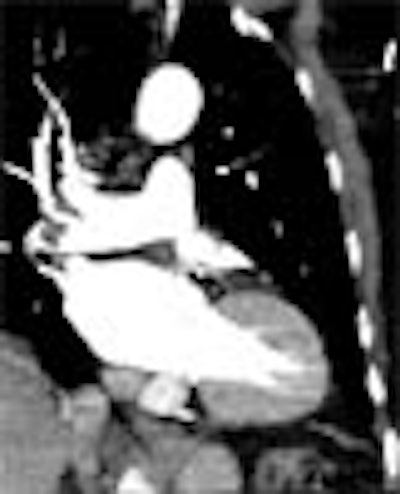
| An 81-year-old woman with acute chest pain and suspicion of acute pulmonary embolism. Short-axis images obtained at end-diastolic (above) and end-systolic (below) phase of the cardiac cycle using ECG-gated 16-slice CT. Right and left ejection fractions were measured at 43% and 41%, respectively. Note the variation of both ventricle volumes and myocardium thickness throughout cardiac cycle. On the same examination, slab MIP oblique reformatted images (bottom) revealed hypodensity in the right pulmonary artery and arteries of the right lower lobe consistent with acute pulmonary embolism. All images courtesy of Dr. Emmanuel Coche. |
 |
 |
The intraclass correlation of measurements for the two observers for RV and end-systolic volumes, end-diastolic volumes, and ejection fraction was 0.97. The intraclass correlation for one observer was 0.98, 0.98, and 0.94 for the same parameters, the group reported.
There was some difference between the measurements, but no statistically significant difference between measurements of the two observers, he said, and the differences between end-systolic and end-diastolic measurements were also statistically insignificant. Seventy-eight percent of the images were graded excellent.
RV volume and ejection fraction measurements obtained during ECG-gated CT were highly reproducible, Coche said.
"The industry will help us, because new software and segmentation tools will be provided and will probably decrease the time of analysis" from the current 10-15 minutes, he said. At the same time, CT scanners with 40-64 detector rows will improve delineation of the endocardial borders. With the 64-slice scanner, it will be possible to scan patients with heartbeats faster than 100 bmp, he said. The technique will probably be used to assess atypical chest pain along with the coronary arteries. The radiation dose was 10.3 mGy.
"I think that MSCT appears as a promising technique to assess with one acquisition right ventricular function, blood vessels, and parenchyma, with acceptable radiation dose and image quality," Coche concluded.
RV function within standard CTA
There are noninvasive alternatives to invasive angiography for assessing RV function, but they are "not without limitations," said Dr. Martine Rémy-Jardin in another ECR 2005 presentation. Rémy-Jardin is from Calmette Hospital and the University of Lille, both in Lille, France.
"The purpose of this study was to evaluate the ... assessment of RV function during the standard CT angiogram (CTA)," she said.
The Lille group, which included Dr. Antoine Teisseire and Dr. Damien Delhaye, examined 69 consecutive patients (38 men, 31 women, mean age 59) with known or suspected right ventricular dysfunction secondary to bronchopulmonary disease or pulmonary vascular disease, Rémy-Jardin said. The goal was to evaluate the underlying disease and include the assessment of right ventricular function.
Following intravenous administration of contrast (80 mL at 2.5 mL/sec), the patients underwent a two-phase CT examination on a 16-slice scanner (Sensation 16, Siemens Medical Solutions, Erlangen, Germany), acquired in the craniocaudal direction. The patients took two deep breaths, one for each phase of the exam, and no medication was administered beforehand. Forty-nine patients also underwent cardiac scintigraphy.
The first set of CTA images were acquired at 16 x 0.75-collimation, 0.5-second rotation, 80-120 kVp, 60-100 mAs, and pitch of 1.5, she said. After a four-second delay came an ECG-gated functional scan, also at 0.75-mm collimation, for the evaluation of both cardiac cavities. The mean scan duration was 25 seconds. The mean heart rate at the time of acquisition was 81 (± 15) bpm.
"With this dataset we reconstructed two series of images, first those related to the diagnostic scan with 1- to 3-mm-thick sections for the evaluation of underlying disease, and for the second acquisition of the cardiac cavities ... overlapping reconstructions."
The results showed that overall attenuation within the right ventricle was 205 HU (± 41, range 120-312), including 199 (upper third), 195 (middle third), and 193 (lower third) (p = 0.32). There was no significant difference in the mean attenuation values compared to three parts of the right ventricle, which were considered during the craniocaudal acquisition, Rémy-Jardin said.
The team used dedicated software (ARGUS, Siemens Medical Solutions) to calculate RV end-diastolic and end-systolic volumes, with calculation of RV ejection fraction performed using the traditional formula. The endocardial borders had to be traced manually because there is still no automated process for the right ventricles, although software does exist for the left heart, she said.
Imaging was technically successful in all 69 patients, and all scans were suitable for calculating the ejection fraction. Manual tracing of endocardial borders was easy in 74% of the cases but less precise in the remaining 26%, she said, due mainly to lower attenuation in these latter cases, or the extrasystolic beats that occurred in approximately 40% of the population.
As for the radiation dose, the mean 7.27 mSv for the functional exam was slightly higher than scintigraphy at 5.18 mSv, but CT provided significantly more information. The dose for the complete exam, including the diagnostic CTA, amounted to approximately 12 mSv. Dose-modulation software was not used, but could reduce the dose in future studies, she said.
"Calculation of right ventricular ejection fraction can be obtained with these kinds of CT equipment," Rémy-Jardin concluded, adding that the technique could be very beneficial in selected patients.
By Eric Barnes
AuntMinnie.com staff writer
May 9, 2005
Related Reading
CT imaging alone may be suitable for workup of pulmonary embolism, November 22, 2004
Thoracic CT expert takes on chronic PE diagnosis, October 15, 2004
Study documents rising use of CT for suspected PE, October 11, 2004
CT for PE: Best test gets better, September 10, 2004
Copyright © 2005 AuntMinnie.com