In this white paper, Adi Abileah, chief research scientist at medical display manufacturer Planar Systems, discusses the importance of monitor calibration, and examines two commonly used methods for calibrating displays.
Why calibrate?
Because diagnostic confidence is critical for reliable image interpretations, users of medical displays need to know that the images they see are accurate depictions of the objects being studied. The view of the image must also be repeatable, not only for one specific display, but for every display in the healthcare enterprise.
Images of objects captured by a modality are stored on the PACS as a file with an array of picture elements with specific digital values based on relative signal levels that have been derived from the imaging equipment. These digital values are used to drive the display so that each picture element is reproduced at the right level of intensity to faithfully portray the image of the object as it was captured.
Calibration of the display system is important to ensure that each image is shown consistently every time it is viewed. LCD monitors need initial calibration to account for ambient conditions and map their light output range to the DICOM curve, then, due to the effects of aging, some form of automated or manual calibration is needed thereafter to ensure that they continue to conform to the standard.
The DICOM curve
The relationship between digital image drive values and displayed luminance on the display is based on models of the human vision system and measurements of how individual pixel values are mapped onto the display screen.
The way the human eye responds to contrasts in light levels is not linear. At low levels, we can notice small changes in luminance. At higher luminance, the change needs to be much greater before we perceive the difference from one level to the next. A curve can be plotted that shows measured luminance levels versus increments of perceived difference.
The DICOM curve was developed to represent how the human visual system is sensitive to changes in contrast. To ensure that all radiology displays are standardized to the way our eyes perceive luminance, the American Association of Physicists in Medicine (AAPM) Task Group 18 developed the DICOM curve.
On the DICOM curve an image is represented on a scale in incremental values from 0 to 1023, with 0 being the darkest and 1023 the lightest. Each grayscale increment corresponds to an increment in luminance, between 0.05 cd/m2 (nits) and 4,000 cd/m2 (nits), that can just be noticed by the eye.
The result is a mapping of levels of luminance versus steps in visual perception. As a result, this DICOM curve describes the specific grayscale output of a display in a defined range of luminance values that are nearly linear in perception. This DICOM curve (fig. 1) is normally shown on a log scale of display luminance versus increments of gray level, and has become an international standard. It is used to ensure an objective, quantitative approach for mapping digital image values to display devices.
By allowing us to standardize and map displays to the contrast sensitivity of the human eye, DICOM calibration ensures that a given gray level will appear the same from one display to the next. It's the standard for viewing of grayscale medical images, and is designed to reproduce approximately the same experience as we would get when viewing film.
 |
| Fig. 1: The DICOM curve shows that the human eye is more sensitive to contrast at low levels (vertical axis shown as the log scale of luminance). Graph courtesy of Planar Systems. |
A primer on how AMLCDs work
To understand how active-matrix LCD (AMLCD) monitors are DICOM-calibrated, we must first understand how they work.
When a drive level voltage is applied to an LCD display, it produces a corresponding output luminance. This output is a combination of light from the backlight going through a liquid crystal element and other optical elements to produce an image that can be viewed by the eye.
An AMLCD monitor has a bright backlight, made up of multiple lamps, that acts like a film lightbox. Light from the backlight flows toward the viewer through an array of pixels, sets of tiny rectangular subpixel elements set into the glass layers of the display. Each subpixel is a light valve of liquid crystal material that opens and closes to let light from the backlight through, depending on the amount of voltage that's applied to it. On top of and below the pixels are layers of polarizers and other optical filters that improve image quality for the viewer. (See fig. 2 below for the basic structure of an AMLCD system.)
 |
| Fig. 2: The layers an AMLCD system. Image courtesy of Planar Systems. |
In thinking about the DICOM curve, it should be noted that every AMLCD also has its own response curve. How much the liquid crystal material rotates to let light through from the backlight depends on how much voltage is applied to the pixel. Apply a lot of voltage and the molecules will rotate all the way, allowing a high degree of light to come through. Apply a small amount of voltage and the material doesn't rotate as much, allowing just a small amount of light to come through.
The amount of voltage needed to control pixels is not linear. In the midrange, around 1.5-2.5 volts, you get almost the full transmission range, but the curve flattens out at the high and low parts of the range. This is known as the response curve of the AMLCD (see fig. 3). It should not be confused with the DICOM curve, and it also must be taken into account when calibrating the display.
 |
| Fig. 3: Typical AMLCD response curve. Graph courtesy of Planar Systems. |
Every liquid crystal element has a slightly different response curve that must be measured and mapped to the DICOM curve. (For example, to achieve a certain digital drive level [DDL] state for pixel #2,999,999, the voltage is x, and for pixel #3,000,000 the voltage is y.) That response map is put into a lookup table (LUT) within the display. Essentially, the LUT becomes a memory map that says, for every pixel or for the average response over the whole panel, we know which voltage will give us a certain amount of output that can be mapped to the DICOM curve.
Studies have shown that liquid crystal material, glass, and optical filters are stable over time and the characteristic response of the AMLCD does not change significantly during the normal use of a display.
Two methods to maintain DICOM calibration
When discussing DICOM calibration techniques, what most people are talking about is checking and maintaining calibration in a display that has already had its initial mapping to the DICOM curve. This checking and maintaining is what we will be referring to as we discuss calibration methods.
DICOM calibration involves two variables:
- Overall peak luminance
- Gray level separation
Overall peak luminance (white level) is provided by the display's backlight, which is set to run at a specific level of peak luminance. The initial maximum luminance of a backlight is usually greater than the peak luminance set point to allow for aging.
Over time, the maximum output of the backlight will decline as the phosphors used in the lamps wear out. Setting the peak luminance to a level below the initial maximum provides some performance margin, and allows the display to run at a continuous peak luminance using the calibration sensor feedback and the lamp control circuit. To maintain the DICOM curve as the display ages, the backlight must be adjusted by the inverter circuit to hold the peak luminance level constant.
Gray-level separation involves accurate voltage control of the drive electronics of liquid crystal elements. This allows for each pixel valve to open or close as needed to provide the required level of light to pass through to produce the grayscale steps needed to achieve the DICOM curve.
In the industry today, there are basically two methods of maintaining calibration for medical displays:
- Method A, which puts a backlight control sensor in the middle of the back of the display to measure peak luminance off the backlight
- Method B, which puts a tiny sensor on the front of the display, located right at the edge or corner of the active area
Method A (backlight control)
 |
| Fig. 4: Method A for maintaining display calibration. A backlight control sensor is placed in the middle of the back of the display to measure peak luminance off the backlight. Image courtesy of Planar Systems. |
Method A places a sensor at the back of the display to measure peak luminance from the display's backlight through the rear reflector without introducing nonuniformities at the front of the panel.
The sensor measures from the center of the display, where the viewer's eye looks most frequently, and it can average over multiple backlight lamps without any attenuation from the liquid crystals, polarizers, and other layers that are in front of the lamps. This results in a direct measurement of the backlight performance, which is a critical factor in establishing the peak luminance of the display and all the subsequent grayscale levels of the display.
This method assumes the following:
- Once the display's lookup table (LUT) is mapped to the DICOM curve at the factory, the liquid crystal matrix stays stable.
- The display's peak white level is held constant by the inverter control circuit for the lamps as their maximum light output degrades.
- Use of a photometer looking at the center area of the backlight is the ideal location for white-level measurements.
- Use of the factory characterization of the liquid crystal matrix response map is the best way to control gray levels.
Method B (corner front view)
 |
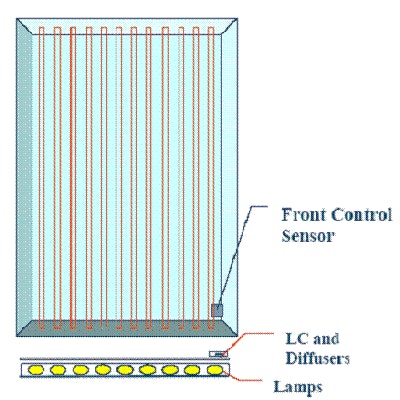
| Fig. 5: Method B for maintaining display calibration. A tiny sensor is placed on the front of the display, located right at the edge or corner of the active area. Image courtesy of Planar Systems. |
With Method B, a small sensor is incorporated on the front edge or front corner of the display, which means the sensor must look through the liquid crystal matrix and its filters. This method is based upon the idea that measuring from the front allows you to take into account any effects of the light passing through the liquid crystal.
This method assumes the following:
- The display's peak white level is held constant by the lamp control circuit as its backlight maximum output degrades.
- Differences between the center of the display and the edge of the display for luminance measurement can be accurately accounted for over time.
- The liquid crystal matrix is not stable due to fluctuations in temperature, and therefore it is necessary to monitor it from the front of the display.
- The effects of ambient light, sensor orientation to polarized light from the liquid crystal, and temperature variations are insignificant when measuring grayscale levels.
Advantages and disadvantages
Both methods of calibration offer advantages and disadvantages, which are briefly outlined below.
Method A advantages:
Larger sensor: Because it is placed at the back of the display, Method A's sensor is larger than the one used with Method B, which must squeeze a small sensor into the corner of the screen without obscuring the user's view. Larger sensors are generally more accurate than smaller ones because of a lower signal-to-noise ratio.
Area: Method A's sensor measures the light of at least three lamps in the center of the display, a larger and more representative area, and it measures away from the end of the lamp, where lamp electrode decay over time cannot distort the calibration measurements.
Direct view of backlight: There is less attenuation of the backlight lamp signal in Method A because the sensor looks at the backlight. Therefore, users do not have to be concerned about whether the light valves (pixels) of the LCD are set correctly when measuring backlight peak luminance. (Method B looks "back" through the filters and liquid crystal, and attenuation from these elements may be an issue.)
Method A disadvantages:
Not in front: Calibration is not done in front, where the viewer is.
No LC detection: Method A cannot remotely determine if the liquid crystal cell has failed. Because the sensor looks only at the display's backlight, the backlight can be working and, even if the liquid crystal isn't functioning, the sensor would not alert the administrator of a nonfunctioning display.
Method B advantages:
Front sensing: With the sensor in the front, calibration takes into account the attenuated signal through the liquid crystal and filters.
LC detection: Because the sensor is in the front, it can remotely detect whether the liquid crystal is functioning.
Backlight diffusers: The front sensor can detect a change in transmission of the backlight diffusers in the corner where it is located, which can indicate a change in the whole diffuser materials.
Method B disadvantages:
Less Accurate. The sensor this method uses needs to be small to fit into the display corner. Smaller sensors are less accurate due to higher signal-to-noise ratios, although this can be somewhat compensated by other means, like increasing measurement sampling time3.
One Lamp. From where the sensor is mounted, it can only look at one lamp at the end of the stack where nonuniform aging can occur.
Conclusion
The calibration of medical imaging displays is critical for radiologists and clinicians to ensure accurate diagnoses of patients' conditions over time.
Two methods for calibrating displays have emerged in recent years -- one that employs a sensor mounted in the back of the display (in the center of the backlight), and one that uses a sensor mounted on the front corner (external). Although both methods have attained widespread market acceptance, healthcare facilities should carefully evaluate the different options to find which one delivers the performance they need.
By Adi Abileah
AuntMinnie.com contributing writer
June 10, 2005
Adi Abileah is a chief research scientist for Planar Systems.
References
1. "Validation of a Self-Calibrating Active-Matrix Liquid Crystal Display System" presented at SCAR 2003 by Stephen K. Thompson, M.S.; Chuck Willis, Ph.D.; Raimund Polman; and Kenneth L. Homann, Department of Diagnostic Imaging Physics, University of Texas.
2. "Digital Imaging and Communications in Medicine (DICOM) Part 14: Grayscale Standard Display Function." Published by National Electrical Manufacturers Association.
3. "Tracking Algorithm for Star Sensors Using CMOS Devices" presented at 4th IAA Symposium on Small Satellites for Earth Observation 2003 by Domenico Accardo, Department of Space Science and Engineering "Luigi G. Napolitano," University of Naples "Federico II."
Copyright © 2005 AuntMinnie.com