VIENNA - Color mapping of cerebral vasculature in 4D CT angiography (CTA) speeds interpretation and may improve accuracy in the detection of vessel occlusions in acute stroke patients, researchers said on Sunday at ECR 2017.
Investigators from Radboud University in Nijmegen, the Netherlands, studied patients with and without cerebral vessel occlusions using a postprocessing technique that color codes the contrast arrival time in acute stroke patients. The goal was to more easily detect delayed contrast arrival in occluded territories. Interpretation time was cut in half, and accuracy was slightly higher with the use of color coding, they found.
"The technique may increase accuracy in vessel occlusions -- though we need more patients and more radiologists to make a firm conclusion about this -- but I really think we can reduce reading time for the radiologists," said Midas Meijs, from Radboud's department of radiology and nuclear medicine, in his presentation.
 Midas Meijs from Radboud University Medical Center.
Time is of the essence in interpretation for patients with acute stroke, which kills nearly 7 million people a year worldwide, according to World Health Organization estimates. Any technique that could speed up interpretation of contrast-enhanced CT while improving the accuracy of ischemic stroke interpretation would be a welcome addition to the clinician's toolbox.
The pilot study was designed to assess the utility of a new technique for 4D CTA for depicting intracranial vessel occlusions in acute stroke, Meijs said. 4D CT involves injecting the patient with a contrast agent and acquiring multiple CT images over time to reveal time-resolved images of the contrast agent filling the vasculature.
"If we look into the vessel, we can see that the time-enhancement curves for the veins, background, and arteries are quite different and quite distinct" on 4D CT, he said. "The problem with these acquisitions, however, is that every patient has a different contrast acquisition, depending on the vascular condition of the patient, the contrast, the injection rate of the contrast agent, and of course [differences] if the patient has a stroke."
The group performed whole-brain CT perfusion on a 320-detector-row scanner (Aquilion, Toshiba Medical Systems) in 10 patients with a single-vessel occlusion and in 10 controls. They obtained color-coded 4D CTA images by centering the color scale of vessel time to peak (TTP) on the modus of the TTP histogram.
The color-coding technique helps to visualize the 4D information from the scan, Meijs explained. Within a vessel mask, time-to-peak calculations for each vessel were assembled and used to create a flow window indicating the arrival time of the contrast agent within each vessel and vascular region.
Two neuroradiologists evaluated the temporal maximum intensity projection (MIP) of 4D CTA with and without color coding for the presence of vessel occlusion, "to see if we could find a difference," Meijs said. For the experiment, they measured time to detection and accuracy for the detection of vessel occlusion.
"Starting the clock, they looked for vessel occlusion, and once they found it the clock was stopped, and we measured the time to detect vessel occlusion," he said.
More to see
With color coding versus without, "there's a lot more information visible in the scan" showing asymmetry in perfusion between the left and right in an acute stroke patient, Meijs said of one example.
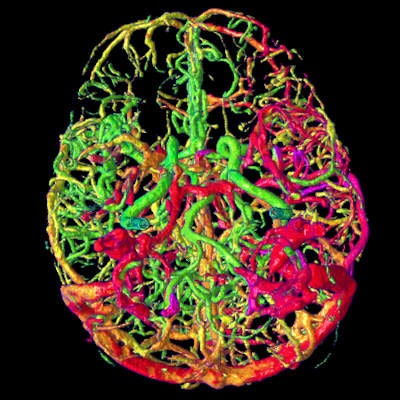
 In the 3D volume rendering above, the reader can see a patient-specific color map, indicating the arrival time of blood to the brain. The color difference between the left and right hemisphere is caused by a vascular occlusion in the M1 segment. Due to collateral flow, the affected hemisphere is supplied with blood at a later arrival time, with orange and red hues indicating contrast arrival times several seconds later than green and blue. The green image below lacks color coding and took longer to interpret. Images courtesy of Midas Meijs.
Overall, the average time to detection decreased from 37 seconds to 19.4 seconds (p < 0.03), and the average accuracy of vessel occlusion detection increased insignificantly from 0.825 to 0.85 with the use of color mapping. A single false-positive vessel occlusion was called by both observers using color mapping. However, both observers found the technique helpful and time-saving.
A new technique for color mapping the cerebral vasculature in 4D CTA improves the speed and may improve the accuracy of the detection of vessel occlusions in acute stroke patients, Meijs concluded. More studies and more patients are needed to determine if the improvement in detection accuracy is significant, he added.
In response to a question from the moderator, Meijs said that although the color coding takes less than a minute, the vessel segmentation task is still time-consuming and will hopefully improve with further development.