An advanced visualization method for virtual colonoscopy (also known as CT colonography or CTC) could help computer-aided detection (CAD) programs slash false-positive rates, according to researchers from the State University of New York (SUNY) at Stony Brook and colleagues. Their recent study of asymptomatic screening patients reduced CAD false positives by nearly half, and could potentially render non-CAD VC image evaluation easier as well.
Existing features for reducing false positives -- based on shape, texture, or lesion morphology -- can already reduce false positives from dozens per patient to 10 or fewer.
But CAD performance might be improved -- and radiologists' comfort with using CAD increased -- if more sensitive visualization methods could be employed to tease more information from the existing CT images, said SUNY's Hongbin Zhu, who discussed his group's results at the 2009 International Symposium on Virtual Colonoscopy in Reston, VA.
"We believe that a procedure of projection or line integral through a volume can enhance the subtle differences in image intensity variation inside the polyp versus normal surrounding tissues," said Zhu, noting the new method's use of a density color-mapping scheme developed at his institution as a translucency rendering tool for the V3D Colon software (Viatronix, Stony Brook, NY) also developed at his institution.
 |
| A projection or line integral through a volume, similar to that used in the Viatronix V3D Colon translucency rendering tool, above, is expected to enhance the subtle differences in image intensity variation inside a polyp versus normal surrounding tissues. To obtain gray projection images, CT densities are simply accumulated along the projection ray. For color images, however, the density values are mapped to colors and integrated with different weighted values, a method developed for the Viatronix translucency tool first described in 2004. All images courtesy of Dr. Hongbin Zhu. |
Other participating centers included the University of Wisconsin in Madison and the Forth Military Medical University in Xi'an, China.
"We would like to automatically extract features based on such ideas for CAD," Zhu said. "First we build up an optimal reference local reference frame, and then we do projections in the frame to generate gray and color images," he said. "With the projected images, we extract the features. CT data in the study were put into such a pipeline for evaluation."
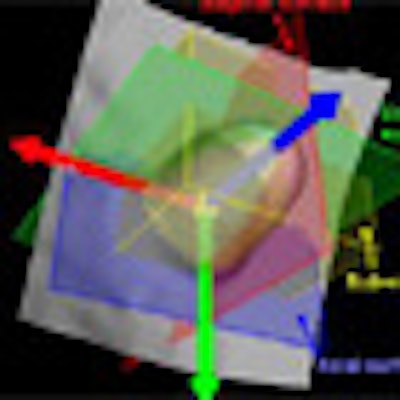
 |
| The method begins by building up the local reference frame based on local differential information, then retrieves a subvolume of the bounding box for each polyp candidate. |
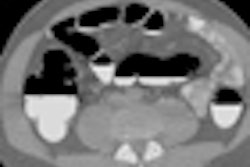
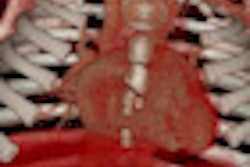
In this manner, three images in either grayscale or color were projected in three optimal directions for each polyp candidate. The resulting images reflected actual image patterns for true-positive lesions, such as a region of increased density, a red core at the center of a lesion, etc.
The results allowed the group to build several new projection-based features into a classifier (supported vector machine) to remove false positives induced by these and other common polyp features. The method used in this study was introduced in an earlier one by Zhu and colleagues Chaijie Duan, Dr. Perry Pickhardt, and Su Wang (Cancer Management and Research, March 2009, Vol. 1:1, pp. 1-13).
"Based on the VM (volumetric mucosa) we employed a level set-based adaptive convolution method for calculating the first- and second-order spatial derivatives more accurately to start the geometric analysis," wrote the authors of the March 2009 study. "Furthermore, to emphasize the correspondence among different layers in the VM, we introduced a middle-layer enhanced integration along the image gradient direction inside the VM to improve the operation of extracting the geometric information like principal curvatures."
Based on the local differential information from these projections, "we build up the local reference frame and retrieve a subvolume of the bounding box for each candidate," Zhu said in his presentation. Next, they performed orthogonal projections in three directions.
CT densities are simply accumulated along the projection ray to get the gray projection images, Zhu explained. But for color, the CT densities are mapped to different colors and "integrated with different weights" as described in a 2004 paper by Pickhardt et al, he said (American Journal of Roentgenology, August 2004, Vol. 183:2, pp. 429-436).
The projection-based features were tested on a database that included 325 VC patient studies consisting of 556 scans, with all results confirmed by colonoscopy. Of these, 258 scans contained 347 clinically significant polyps measuring 5 mm to 60 mm.
 |
| Projected images show results of new method at right. Top four rows show colonic polyps measuring 35 mm, 12 mm, 9 mm, and 6 mm, respectively, followed by stool, a prominent fold, rectal tube, and ileocecal valve. |
The first experiment used only the well-established features, such as first- and second-order statistics of the shape index, as well as CT values, Zhu said. The second experiment used the established features and added the new ones. Finally, the results were compared using both feature sets.
 |
| Chart shows new and existing features for false-positive polyp candidate reduction. |
At 95% per-polyp sensitivity, false positives per scan totaled 7.8 and 4.3, respectively, for the two experiments -- a 44.9% reduction using the new features, Zhu reported.
"At a sensitivity level of 95%, we gained a 44.9% reduction of false positives if the projection-based features were included," he said. "The reduction in false positives is clinically meaningful. Our database is large and derived from two institutions."
The new projection features can effectively reduce false positives and increase detection specificity without sacrificing polyp detection sensitivity, Zhu concluded.
By Eric Barnes
AuntMinnie.com staff writer
March 10, 2010
Related Reading
VC CAD application does well alone and as reader aid, February 15, 2010
New VC CAD algorithm reveals submucosal colon cancers, February 4, 2010
VC screening effective in Medicare-age screening cohort, January 27, 2010
VC CAD nabs undetected polyps in jumbo screening study, October 29, 2009
Readers undaunted by VC CAD false positives, June 12, 2009
Copyright © 2010 AuntMinnie.com