AuntMinnie is pleased to present Part II of a three-part series on Alzheimer's disease, based on research presented at the 2001 Society of Nuclear Medicine meeting in Toronto.
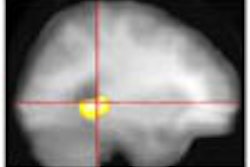
PET images of Alzheimer's disease patients show a typical pattern of hypometabolism in the temporal and parietal regions of the brain. However, metabolic patterns vary widely among AD patients, due to factors such as individual variations in brain structure, disease stage, different genetic markers, and different types of dementia.
And because cognitive decline is part of the diagnosis, AD studies must incorporate mental function tests. Even in the best of circumstances, performance can vary widely due to differences in age, education, and intellectual abilities among subjects, as well as other factors such as compensatory mechanisms that may occur in response to functional decline.
Faced with such daunting complexities, researchers have tended to approach the Alzheimer's puzzle by grasping small pieces of it. In tightly designed studies using carefully screened patient groups, they have sought to answer some of AD's most important questions. For example: How do metabolic patterns relate to measured cognitive decline? How does metabolic dysfunction relate to brain atrophy? Which patients with mild cognitive decline will progress to AD? The disease is thought to afflict more than 15 million people worldwide, with more expected as the world's population ages.
At the 2001 Society of Nuclear Medicine meeting in Toronto, researchers offered important insight into these questions. Among them, a group from the Nuklearmedizinische Klinik in Munich, Germany studied patients diagnosed with mild cognitive impairment (MCI), and found greater-than-expected metabolic declines in the frontal cortices. The results could help doctors predict which cognitively impaired patients might progress to AD.
From mild cognitive impairment to AD
"The aim of this study was the identification of cerebral metabolic changes associated with clinical conversion from MCI to Alzheimer's disease," said lead researcher Dr. Alex Drzezga.
The 22 MCI subjects (12 males and 10 females, average age 69) were recruited according to the criteria of Peterson et al (1995). All of them underwent brain imaging with 18FDG-PET, once at baseline and at follow-up a year later. Imaging was performed with an ECAT PET scanner (Siemens, Erlangen Germany) in 3-D mode, 30 minutes after administration of 370 Mbq of FDG-PET.
The resulting image data were coregistered and stereotactically normalized using Neurostat software (University of Michigan, Ann Arbor). The results were then analyzed statistically using a general linear model to compare scans and groups using SPM96 software (Functional Imaging Laboratory, London, U.K.).
"According to a neuropsychological reevaluation, the patients [were] differentiated clinically into two major subgroups: First, MCI patients who developed clinical AD within one year; the second group [which did not advance to AD]; and the third group, which remained in the MCI category [but] with progression of cognitive decline," Drzezga said.
At the one-year follow-up, 6 of the 15 MCI patients had progressed to probable AD. Significant metabolic differences (p <0.01) were found in the patients who progressed to AD compared to those who remained MCI.
"MCI patients who later developed clinically diagnosable Alzheimer's disease showed significantly lower metabolism in the posterior cingulate cortex, as compared to patients who remained in the MCI category," Drzezga said.
In the 6 patients who progressed to AD, a comparison of metabolic changes between the initial and follow-up scans found greater metabolic decreases in the left frontal cortex, most significantly in Brodmann area 45 (Z=3.9).
"Compared to completely unchanged MCI patients, an additional abnormality in the left temporal lobe reached a significant level," Drzezga said, noting significant metabolic deficits in the mesiotemporal cortex of those who progressed to AD.
An analysis of changes in patients who progressed to AD showed metabolic decline in the frontal cortex, the posterior cingulate cortex, and the left temporal cortex, he said.
"MCI patients with progressive symptomology interestingly show similar [metabolic] changes, whereas [symptomatically] unchanged patients show hardly any metabolic changes at all," Drzezga said.
Significant metabolic decline was seen in the hippocampi of progressive MCI patients compared to stable MCI patients, but not in the group that progressed to AD. The team will examine this apparent inconsistency in subsequent studies, Drzezga said.
An analysis of changes within groups, known as the "difference of differences," showed that later AD patients had the most significant declines in the right prefrontal cortex. But compared with unchanged MCI patients, the later AD patients showed significantly stronger decreases in left temporal cortex metabolism.
"Conclusively, MCI patients who developed AD within one year showed metabolic deficits initially compared with other MCI patients, in [posterior association cortices] typically affected by AD," Dzrezga concluded. "The conversion from MCI to clinically manifest AD is accompanied by a reduction of cerebral metabolism in the frontal and posterior cingulate cortex, and MCI patients with further cognitive decline already show changes similar to patients who progress to AD."
Brain atrophy vs. metabolic decline alone
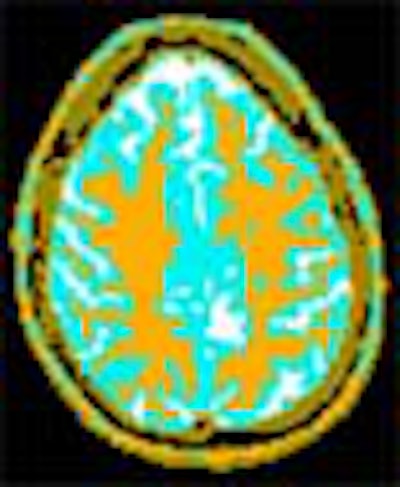
A later presentation at the SNM conference examined the extent to which brain atrophy is responsible for metabolic decline in AD patients. Christina (Hsaio-Ming) Wu from the department of molecular and medical pharmacology at the University of California, Los Angeles led a study that used double-echo MRI and FDG-PET to examine the partial-volume effect.
The researchers concluded that the relative significance of brain atrophy vs. metabolic decline alone may differ between subjects with and without a genetic predisposition to AD.
In previous PET studies, cerebral regions shown to have reduced FDG uptake in AD patients also show reduced uptake in asymptomatic persons with the alipoprotein E4 (APO E4) allele used to indicate a genetic risk for AD, Wu said.
However, because it is not clear whether the reduced metabolism can be attributed to tissue atrophy or functional changes alone, the researchers created a partial-volume effect technique to distinguish the two factors.
In the study, double-echo MRI and FDG-PET imaging were conducted on 7 APOE4+ subjects, 7 APOE4- subjects, and 7 patients with probable AD.
"FDG uptake was assessed in several regions of interest [ROI]: the left and right sides of the inferior parietal, inferior temporal, lateral temporal and posterior cingulate [regions]," Wu said.
The partial-volume effect (PVE) was based on the size of the regions in MRI images. The researchers segmented the coregistered MRI images, simulated gray matter PET images, and generated "gray masks" to mimimize spillover at the gray-white interface, Wu said. FDG uptake was compared with and without partial-volume correction among patient groups.
 |
According to the results, the PVE corrections affected the outcome of regional uptake comparisons in all three patient groups, Wu said. Without PVE correction, ROI size influenced regional uptake levels. With PVE correction, results were independent of ROI sizes.
In the AD subjects, uptake reductions in the left and right inferior parietal and inferior temporal regions were significant (P<0.05) compared to those of APOE4- subjects. After PVE correction, uptake in the left and right inferior and left inferior temporal regions was significant, indicating functional changes in AD patients.
Compared to APOE4- subjects, APOE4+ subjects had lower uptake (P<0.05) in the left and right inferior parietal regions. After PVE correction, uptake in the left inferior parietal region of APOE4+ subjects remained significantly lower than that of APOE4- patients, strongly indicating functional involvement in this region.
"The functional change in the right inferior parietal may be masked by the different amount of atrophy between the AD and the [APOE4-] subjects, and the hypometabolism observed in these regions may be due to more atrophy in AD patients compared with [APOE4-] subjects," Wu said.
The PVE technique could be used to differentiate between functional changes alone and tissue atrophy, Wu concluded.
"We confirmed that the genetic allele E4 is associated with reduced cerebral glucose uptake in regions such as the inferior parietal in patients with a clinical diagnosis of AD," she said. "And the relative distribution of tissue atrophy and functional change ... may vary [between] AD patients and persons with the APOE4 allele."
Functional reserve predicts cognitive decline
In a subsequent presentation, Dr. S. Kwee and colleagues from the University of Washington in Seattle and the University of Michigan in Ann Arbor estimated metabolic functional reserve in an effort to predict cognitive decline, a process that is highly variable and difficult to predict.
"Functional brain imaging has been studied as a diagnostic tool, because it allows quantitative measurements of brain physiology," Kwee said.
Functional imaging studies have suggested that neuronal reorganization within the association cortices may account for wide variations in regional uptake among at-risk patients, complicating the task of predicting who will progress to AD, he said.
In the study, two groups of subjects underwent imaging with FDG-PET. The first was a cross-sectional group of 37 AD patients with mild to severe dementia as measured by mini mental state examination (MMSE) scores ranging from 0 to 23. This group's scores were used to create standard metabolic levels for use by the second group.
The second group consisted of 22 patients with mild dementia, whose MMSE scores ranged from 15-23. This group underwent follow-up imaging at 30 (+/- 7) months.
Cerebral glucose metabolic rates (CMR) normalized to thalamus of averaged fronto-temporo-parietal association cortices in the first group were used to create a linear regression formula for expected CMR, with initial MMSE scores as an independent variable.
The group defined the difference between actual and expected CMR as a measure of functional reserve, and correlated this value with the change in MMSE scores over time.
The results showed a significant relationship (p<0.001) between CMR and MMSE scores over time of 0.7% per MMSE point. The correlation remained strong after eliminating the effects of age, gender, follow-up, interval, age of onset, and initial MMSE score, Kwee said.
"Our index is a quantitative measure of metabolic deviation from group estimates, which accounts for a significant portion of this variability," he said, noting that while the results are consistent with neuronal compensation in AD, the mechanism underlying compensatory reallocation per se has not been fully elucidated, and requires further investigation.
"Functional reserve in the association cortices as measured by glucose metabolism is a strong independent predictor of cognitive decline in patients who presently have mild dementia," Kwee said. "Thus, it may be useful as a significant covariate in research and clinical outcome studies that require a quantitative prognostic index in Alzheimer's disease."
By Eric BarnesAuntMinnie.com staff writer
October 2, 2001
Related Reading
Alzheimer's disease, Part I: PET yields surprising findings in hippocampus, September 7, 2001
PET predicts future cognitive decline, June 26, 2001
PET, SPECT differ in Alzheimer's imaging, June 25, 2001
Nycomed Amersham, Neurochem to collaborate on Alzheimer's agents, July 19, 2001
New Alzheimer's guidelines reflect recent "explosion of information," May 8, 2001
SPECT increases accuracy of Alzheimer's diagnosis, April 19, 2001
New PET radiotracer could replace FDG for detecting Alzheimer’s, March 26, 2001
PET and MRI race to detect early Alzheimer’s, January 22, 2001
Copyright © 2001 AuntMinnie.com