Today is World Osteoporosis Day and this year's theme is "Move it or lose it," as decreed by the International Osteoporosis Foundation. Planned activities include a virtual fitness rally in the U.S.; nationwide dance parties in Romania; and a full-day of Icelandic seminars on bone health, including a coffee break with "calcium-rich refreshments."
Earlier this week, the Hong Kong Osteoporosis Foundation and the Osteoporosis Society of Hong Kong held an event titled "Thousand People Group Osteoporosis Exercise."
While the good citizens of Hong Kong took to the streets for bone-building activities, doctors at the Chinese University of Hong Kong have been hard at work learning more about what causes bone density loss to begin with.
 |
| The "Thousand People Group Osteoporosis Exercise" event, held in the Kowloon district in Hong Kong, brought together people of all ages who took part in bone-building routine en masse. Sunday's festivities also offered nutritional consultations and a booth to measure body mass index. Images courtesy of the Hong Kong Osteoporosis Foundation and the Osteoporosis Society of Hong Kong. |
 |
"Current techniques ... such as bone densitometry and quantitative computed tomography, can help assess the end result of osteoporosis, but provide little information regarding the underlying pathophysiology of the disease," wrote Dr. James Griffith and colleagues in a study published in Radiology. "Our (MRI) study results show that decreasing marrow perfusion and increasing marrow fat content accompany a reduction in bone density" (Radiology, September 2005, Vol. 236:3, pp. 945-951).
For this prospective study, the authors used 1H MR spectroscopy (MRS) and dynamic contrast-enhanced MRI in older men with varying levels of bone mineral density (BMD). Eight-two subjects with a mean age of 73 years were enrolled.
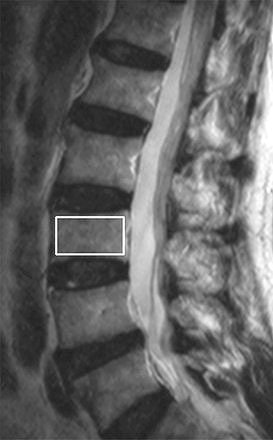 |
| Results of 1H MR spectroscopy of L3 vertebral body in 74-year-old man with osteoporosis (T-score, -3.5). Above, sagittal T2-weighted MR image (3500/120) of lumbar spine shows positioning of the volume of interest for spectroscopy (white box) within the L3 marrow cavity. |
In an e-mail to AuntMinnie.com, Griffith explained why they chose to work with a male patient population, especially since osteoporosis is more likely to occur in women.
"Men were chosen simply because they were being recruited for another study at that time. Osteoporosis is more common in females than males in Hong Kong," stated Griffith, who is from the university's departments of diagnostic radiology and organ imaging. His co-authors are from the departments of orthopedics and traumatology.
All participants underwent DEXA scans (QDR 4500W, Hologic, Bedford, MA) of the lumbar region (L1-L4) at least one month before MRI. A T-score greater than -1.0 indicated normal BMD, between -1.0 and -2.5 represented osteopenia, and less than -2.5 was indicative of osteoporosis.
MR exams were performed on a 1.5-tesla unit (Intera NT, Philips Medical Systems, Andover, MA) at the L3 vertebral body for optical coil positioning with iliac crest landmarks. T1- and T2-weighted imaging of the lumbar spine in the sagittal plane was done. Dynamic, gadoteric acid-enhanced MR images were acquired in the sagittal plane as well. Spectroscopic data from L3 was analyzed.
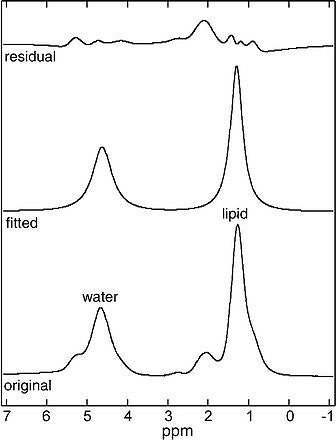 |
| 1H spectrum acquired from this volume of interest shows a relatively intense lipid peak (1.3 ppm) compared with the intensity of the water peak (4.65 ppm); this finding indicates that there is increased marrow fat content within the vertebral body. The bottom tracing is the original spectrum; the middle tracing is the fitted spectrum, from which peak intensity values were derived; and the top tracing is the residual spectrum. |
The results showed that BMD was normal in 42 subjects, osteopenic in 23, and osteoporotic in 17. For the mean vertebral fat content of all 82 subjects, the mean line width of the unsuppressed water peak was 34.3 Hz.
The mean line width for the lipid peak was 32.5 Hz. The osteoporotic men had the highest mean value (58.23%) of vertebral fat content.
In terms of vertebral marrow perfusion, the average maximum enhancement for all subjects was 28.8% with the osteoporotic subjects having the lowest enhancement (23.52%).
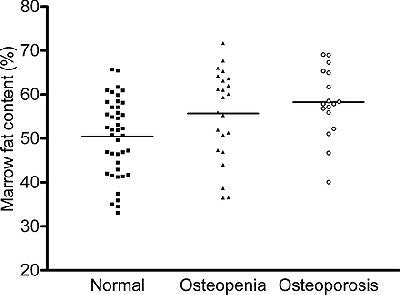 |
| Graph shows marrow fat content distribution among the three subject groups (i.e., subjects with normal BMD, subjects with osteopenia, and subjects with osteoporosis). The mean value for each group is represented by the horizontal bar. Figure 1a, b, c. Griffith JF, Yeung DKW, Antonio GE, et al. "Vertebral Bone Mineral Density, Marrow Perfusion, and Fat Content in Healthy Men and Men with Osteoporosis: Dynamic Contrast-enhanced MR Imaging and MR Spectroscopy." Radiology 2005;236:945-951. |
Finally, the researchers looked at the correlation between bone density, vertebral marrow perfusion, and fat content. They found that in all patients, the increase in marrow fat content correlated strongly with a decrease in maximum enhancement and enhancement slope.
"The results of this study show that the observed reduction in vertebral marrow perfusion in older male subjects is related to bone density," Griffith's group wrote. In addition, "our results show that vertebral marrow fat content is related to bone density."
They outlined some potential reasons for this relationship. First, an increase in marrow fat may represent a compensation for trabecular thinning. Also, the increasing fat could be compressing the intraosseous veins, thereby diminishing blood flow.
In an accompanying Radiology commentary, Dr. James Fleckenstein from the Tulsa Spine Hospital in Oklahoma pointed out that a study such as this one offers "suitable alternatives to bone density determinations in the management of osteoporosis" (September 2005, Vol. 236:3, pp. 745-746).
Indeed, Griffith told AuntMinnie.com that he did not see MR and MRS becoming standard screening tools. Instead, physiologic information on bone aging gleaned from contrast-enhanced MRI/MRS studies could be used to tailor treatment plans for osteoporosis patients or even prevent onset of the disease, he stated.
Fleckenstein wrote that a study still needed to be done that would evaluate the "test-retest reliability of the marrow changes -- information that would be needed to know how much of a change in two MR measurements at different times is due to variability in the measurement rather than to biologic changes."
Griffith said his group is currently engaged in studies to test the reliability of MR. They also recently completed similar research on a larger, female patient population.
By Shalmali Pal
AuntMinnie.com staff writer
October 20, 2005
Related Reading
Infliximab improves bone mineral density in Crohn's patients, October 7, 2005
Fruits, veggies help build strong bones in boys, September 29, 2005
Statins reduce fracture risk in men, September 27, 2005
Copyright © 2005 AuntMinnie.com

