The first Hessian matrix-based computer-aided detection (CAD) algorithm for colorectal polyps yielded acceptable sensitivity and false-positive rates, according to researchers from Seoul, South Korea.
The investigational virtual colonoscopy (VC) CAD scheme eschews the more common curvature-based approach for polyp detection, instead analyzing "blob-like" shapes it detects in the CT data to determine if they meet the criteria for polyps. The system was tested on patients with an elevated risk of colorectal polyps and cancer, with colonoscopy and radiology used as reference standards.
"Among the five typical tasks of the CAD system, the detection of polyp candidates requires an appropriate method to characterize these shape differences into polyps, folds, and the colonic wall," wrote Dr. Se Hyung Kim, Dr. Jeong Min Lee, and their colleagues from Seoul National University College of Medicine, and Dr. Philippe LeFere from Stedelijk Ziekenhuis in Roeselare, Belgium (American Journal of Roentgenology, Vol. 189:1, pp. 41-51).
At the turn of the century, Sato et al (IEEE Trans Visualization and Computer Graphics, 2000, Vol. 6, pp. 160-180) described the Hessian matrix, the square matrix of second partial derivatives of a scalar-valued function. This algorithm enhancement of curvilinear structures such as vessels in 3D imaging is considered to be more sensitive for classifying local shape features constructed of three independent parameters, Kim and his colleagues explained.
"Calculation of the Hessian matrix on 3D CT data and Eigen decomposition of the matrix result in three Eigen values and vectors at each voxel," they wrote. The Eigen values make it possible to determine which type of intensity structure, blob (polyp), line (fold), or sheet-like (colon wall) a given voxel represents. Sahiner et al applied this method successfully to the detection of lung nodules, but previously it had not been attempted in colonic polyps.
The study examined the virtual colonoscopy datasets of 35 patients, including 24 with known polyps as a result of colonoscopy or flexible sigmoidoscopy. All but two of these patients were asymptomatic screening subjects. The remaining 11 datasets were from a larger group of 200 asymptomatic patients in whom polyps were found at VC and who were given IV contrast before supine scanning (150 mL iopromide at 3 mL/s following a 70-second scan delay). This second group of patients was also given midazolam as an IV sedative prior to conventional colonoscopy, which served as a reference standard in all 25 patients.
Prone and supine virtual colonoscopy studies were acquired on an 8- or 16-detector-row CT scanner (LightSpeed Ultra, GE Healthcare, Chalfont St. Giles, U.K. or Sensation 16, Siemens Medical Solutions, Erlangen, Germany, respectively), following a cathartic bowel preparation with polyethylene glycol. Collimation was set at 1.5 mm or 1 mm, respectively, and images were acquired at 120 kVp and 150 mAs for both scanners.
The images were analyzed by the investigational CAD scheme following colonic segmentation using seeded region-growing isosurface-generation models, using a threshold of -475 HU for the colonic lumen and -800 HU for the isosurface. Following generation of the lumen surface, a 3D shape-based filtering method was applied based on gradient vector and Hessian matrix of volume intensity function, classifying each structure into polyp, fold, or colonic wall.
 |
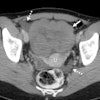
| Above, a 45-year-old woman with 6-mm hyperplastic polyp in the rectum. On CT colonographic images in supine view, part of polyp (arrow) is colored red and detected with computer-aided detection scheme on both supine and prone datasets. Note endoluminal appearance of polyp on each dataset (right lower corner). Republished with permission of the © American Roentgen Ray Society, by Se Hyung Kim, Jeong Min Lee, Joon-Goo Lee, Jong Hyo Kim, Philippe A. Lefere, Joon Koo Han, and Byung Ihn Choi, from AJR 2007; 189:41-51). |
 |
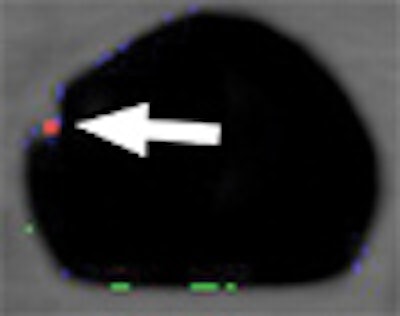
| Examples of false-negative lesions by computer-aided detection (CAD). A 10-mm flat adenomatous polyp in sigmoid colon was missed by CAD. Axial 3D endoluminal (right lower corner). Supine CT colonography images show polyp (arrow) that is not tagged with red. Republished with permission of the © American Roentgen Ray Society, by Se Hyung Kim, Jeong Min Lee, Joon-Goo Lee, Jong Hyo Kim, Philippe A. Lefere, Joon Koo Han, and Byung Ihn Choi, from AJR 2007; 189:41-51). |
"Before applying the Hessian matrix decomposition to the CTC dataset, gaussian blurring had to be done to enhance specific 3D local intensity structures," Kim et al wrote. "However, if a large gaussian smoothing factor is applied, the distinction between polyps, folds, and colonic wall becomes weakened. In addition, to further enhance detectability of polyp candidates, the shape threshold also had to be determined. The diagnostic performance of a CAD scheme is represented by both sensitivity and the number of false positives. There is an inherent trade-off between the two."
Investigating this tradeoff, the researchers used three combinations of gaussian smoothing factors and shape thresholds. The results showed that setting 1 had the highest sensitivity at 42.9% for all polyps, but also the highest number of false positives, averaging 14 per case. Setting three had the lowest sensitivity for all polyps at 23.8%, but the lowest number of false positives, averaging 5.3 per case.
Overall, conventional colonoscopy found 94 polyps, including six smaller than 6 mm and 48 that were 6 mm or larger. In a retrospective review without CAD, 79.8% of the polyps were found by radiologists. CAD found 77.1% of the polyps 6 mm or larger according to colonoscopy, but 92.5% (37/40) per polyp and 91.7% (22/24) per patient of the ≥ 6 mm polyps using the easier reference standard of radiologists' findings at the retrospective review.
CAD missed 51 polyps, including 25 adenomatous, 13 hyperplastic, and 13 inflammatory polyps. However, 19 lesions were missed by radiologists at retrospective review, including seven adenomatous, 10 hyperplastic, and two inflammatory polyps. Two polyps (8 and 10 mm) in the sigmoid colon had a flat appearance at conventional colonoscopy.
As for CAD's false positives, most were common perception errors similar to those made by radiologists, but most could be distinguished from true positives by an experienced radiologist, the authors noted. Residual fluid due to the "wet" polyethylene glycol prep was responsible for many of the false positives.
Among the limitations cited by the authors, the dataset was small, and the training and testing data were identical. The algorithm also stopped at detection of polyp candidates. "...applying the final step of the CAD scheme, that is, false-positive reduction, will be necessary to further decrease the number of false-positive detections," the group wrote.
"Compared with other detection algorithms in which only one or two shape parameters are used, the Hessian matrix-based algorithm uses three morphologic structures (line, sheet, and blob) calculated from each voxel on 3D CTC images, providing a detailed morphologic description of the candidate surface," Kim and colleagues wrote. Eigen values and vectors were applied to basic conditions for each of these morphologic local structures to determine the likelihood of each shape.
While sensitivity and false positives were acceptable for this stage of development, the authors added, false-positive reduction will be needed in the future.
By Eric Barnes
AuntMinnie.com staff writer
July 9, 2007
Related Reading
Fully automated VC CAD system solves tagging problems, June 25, 2007
Noncathartic bowel prep facilitates, complicates virtual colonoscopy, June 15, 2007
New developments improve VC -- and colonoscopy, April 6, 2007
VC CAD ramps up detection of medium-sized polyps, March 12, 2007
CAD struggles through tagged, subtracted VC data, May 18, 2005
Copyright © 2007 AuntMinnie.com