Many imaging facilities with digital x-ray technology are looking to mine the data in their PACS archives as a tool for monitoring and reducing radiation dose. Australian researchers believe they've developed a computed radiography (CR) data-mining application that could make it much easier for imaging sites to track CR dose.
Digital x-ray technologies such as CR and digital radiography (DR) can help a department operate more efficiently, but they can also lead to "dose creep," a phenomenon in which radiation dose slowly rises after conversion to digital imaging. The wide dynamic range of digital x-ray favors overexposed images, which can be corrected via postprocessing, whereas underexposed images acquired with less radiation dose are undesirable due to noise.
CR manufacturers provide exposure index measures with their machines that can be examined to determine when radiation delivered to the CR imaging plate exceeds acceptable levels. These data are available on images stored within the PACS archive, and previous research has demonstrated that data-mining applications can be used to access exposure indices as part of a quality assurance program to reduce dose creep and patient overexposure.
Data mining's drawbacks
But these early efforts at data mining suffered from several drawbacks, according to a new study published online ahead of print on July 27 in Computer Methods and Programs in Biomedicine. Most have been limited to analyzing data from just one CR manufacturer, because each vendor uses a different terminology and scale to represent dose: Fujifilm Medical Systems of Tokyo uses sensitivity number (S-number), Agfa HealthCare of Mortsel, Belgium, uses logarithm of median exposure (Lgm), and Carestream Health of Rochester, NY, uses exposure index (EI).
Perhaps more importantly, the data-mining methods used in earlier studies have required manual intervention to retrieve data from the PACS archive. In addition to being tedious, manual processes can contribute to errors, such as the misspelling of patient names, that PACS administrators must correct, according to lead author Curtise Ng, Ph.D., of the department of imaging and applied physics at Curtin University of Technology in Perth.
A better system would be completely automated, allowing exposure index data to be automatically generated and viewed online via a Web browser. To that end, Ng's team developed a CR dose data-mining application that queries information stored in the institution's PACS archive, based on the Conquest open-source DICOM server software.
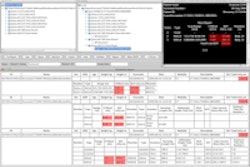
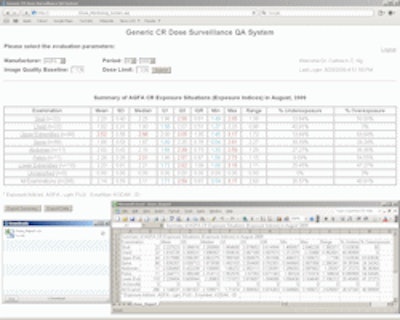
Users of the software can execute searches using different parameters, such as CR manufacturer, study period, image quality baseline, and dose limit. "Image quality baseline" represents the base level of exposure index needed to obtain a diagnostic-quality image; images below this level are underexposed, and data from theses studies appear in blue in the dose reports.
 |
| Click here to enlarge this image. |
| The dose data-mining software analyzes CR exposure indices, highlighting underexposed studies in blue and overexposed exams in red. Image courtesy of Curtise Ng, Ph.D. |
At the other end of the spectrum, "dose limit" represents an exposure index level at which the image has been overexposed, and these exams are rendered in red on dose reports. Both image quality baseline and dose limit are based on recommended exposure index values set by CR vendors, but they can be modified by users.
To enable facilities to track their dose performance, the software can perform analyses such as mean, standard deviation, median, and percentage of under- and overexposed images. Results can be exported to a comma-separated values (CSV) file and sent to a Web browser for display. Undesirable images can also be retrieved from the database for further review, Ng said.
The researchers tested the application with 69 CR images (27 acquired with Agfa systems and 42 with Fuji units) and verified the extracted DICOM data and statistics by comparing them to data derived via a manual approach. They found no discrepancies between either method.
Clinical use
How would the software be used in a clinical environment? Ng's department doesn't operate a clinical radiology service, so he's looking for partners to test the application in a real-world environment. He believes it would be an improvement over the current practice in Western Australia, in which exam room supervisors and PACS administrators have to review the exposure index of each image through CR workstations.
"This program can save them time, and they can concentrate on doing other more important clinical duties," Ng said. "Also, this program can provide more accurate results than the manual process."
The software could also be used to track the performance of individual radiographers (radiologic technologists), assuming that a facility requires staff members to input their identifiers when acquiring images.
In future research, Ng would like to see the software expanded to cover other imaging modalities, such as CT and DR, and products from other CR manufacturers. It's also possible to add a feature in which dose delivered to particular patients could be tracked over time -- a particularly important option as attention focuses on electronic patient records.
"The dose data-mining program can promote the approach of monitoring CR doses regularly and efficiently, so as to reinforce the ALARA [as low as reasonably achievable] principle," the researchers wrote.
By Brian Casey
AuntMinnie.com staff writer
September 9, 2009
Related Reading
QA application can bolster DR image quality, consistency, December 22, 2008
Large CR study reveals wide variation in adult and pediatric protocols, September 3, 2008
PACS data-mining tool analyzes CR retake rates, August 5, 2008
PACS data-mining technique tackles CR dose creep, July 30, 2007
Copyright © 2009 AuntMinnie.com