ANAHEIM, CA - Researchers are reporting early success in adapting a new method of calculating beta-amyloid accumulation, as seen in PET scans, for people with Down syndrome. Study results were presented on Monday at the Society of Nuclear Medicine and Molecular Imaging (SNMMI) annual meeting.
The quantification algorithm measures the burden of beta-amyloid plaques, a precursor to Alzheimer's disease and dementia. The information could be particularly helpful for tracking the protein in people with Down syndrome, who are inherently at greater risk for dementia.
"For our work, we want to move the Down syndrome population toward clinical trials on Alzheimer's prevention, and feel that amyloid [PET] imaging can serve a significant role in this process," said lead author Matthew Zammit from the University of Wisconsin-Madison. "Therefore, we want to find the metric that has the highest sensitivity to detect change in [beta amyloid], which was our motivation for looking at [beta-amyloid] load."
Trisomy 21
Down syndrome, also known as trisomy 21, is characterized by the presence of three No. 21 chromosomes instead of two. This results in the triplication of a gene associated with amyloid production and an increase in beta-amyloid plaques in the brain. The presence of plaques is detectable on PET imaging by age 40 in this population, who then face a 75% prevalence of Alzheimer's by age 65.
Unique to Down syndrome-specific and other forms of familial Alzheimer's disease is a pattern of beta-amyloid deposition first appearing in the striatum region of the brain. Usually, the cortex is the initial starting point for the development of beta-amyloid plaques in the early stages of Alzheimer's. In fact, under normal conditions, the striatum is the last region to accumulate the protein.
Until recently, PET analysis was limited to standardized uptake value ratios (SUVr) for the quantification of beta-amyloid accumulation. Earlier this year, two U.K. researchers developed a method called beta-amyloid load to improve PET quantification (Whittington and Gunn, Journal of Nuclear Medicine, April 2019, Vol. 60:4, pp. 536-540).
The algorithm "uses a logistic growth model to describe the accumulation of [beta amyloid] over time," Zammit explained to SNMMI attendees. "From these estimates, the algorithm outputs the [beta-amyloid] load, which is a global outcome measure influenced by all voxels in the image containing [beta amyloid]."
Whereas SUVr analysis looks at regional changes in beta amyloid, a global SUVr is generated by analyzing multiple regions of interest (ROIs) and averaging their values together.
"Depending on the ROIs and the global SUVr, this can influence the outcome" of beta-amyloid measurements, he added. "With [beta-amyloid] load, the global value of a [beta-amyloid] burden is derived from all [beta amyloid]-containing voxels using a weighted matrix to describe the total ... carrying capacity (K) within each voxel."
Beta-amyloid load
Following this idea, the goal of the current study was to test the beta-amyloid load metric with Down syndrome data and compare the results with SUV ratios to track longitudinal changes and the possible progression to Alzheimer's.
The researchers analyzed 169 adults with Down syndrome who were recruited through the Alzheimer's Biomarkers Consortium-Down Syndrome (ABC-DS) study currently conducted by two research groups: Neurodegeneration in Aging Down Syndrome (NiAD) and Alzheimer's Disease in Down Syndrome (ADDS). The ABC-DS study's objective is to monitor longitudinal changes in Alzheimer's biomarkers, including amyloid and tau proteins, and see how those fluctuations relate to cognitive decline.
The subjects had a mean age of 39.6 years (± 8.7 years) when they underwent a 50- to 70-minute carbon 11-labeled Pittsburgh Compound B (PiB) PET scan. Among the participants, 68 (40%) underwent at least two PiB-PET scans, 50 (29%) had at least three scans, and 14 (8%) had at least four scans, for a total of 301 PiB-PET scans.
The original beta-amyloid load model proposed by Whittington et al did not include the striatum as an input parameter, so to make this approach Down syndrome-specific, Zammit and colleagues added the striatal PiB signal to their research.
The mean time between multiple scans was 2.3 years (± 0.6 years; range, 1.7-2.9 years), with some participants tracked for as long as eight years.
PiB-PET calculations
Zammit and colleagues also used the cerebellum gray matter as their reference standard. They then calculated global SUVr from five different ROIs as well as the striatal ROI.
"In order to calculate [beta-amyloid] load from SUVr images, we first estimated the [beta-amyloid] growth rate from our population data," Zammit said. "We started by calculating the longitudinal rates of change in SUVr per year and plotted them in relation to their baseline measurements."
The researchers distinguished between PiB-positive and PiB-negative subjects using a beta-amyloid cutoff of 26.1%, which was determined by clustering of the dataset.
They found that beta-amyloid load showed strong agreement with global SUVr, with a Pearson correlation coefficient (r) of 0.97 between the two metrics (p = 0.00001). In addition, there was no correlation between nonspecific PiB binding and SUVr (r = -0.09), which suggests that increases in SUVr are strongly associated with increased beta-amyloid levels.
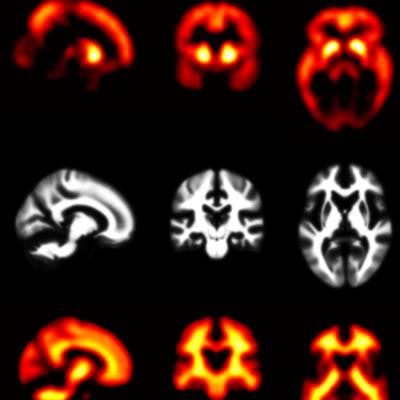
 PiB-PET images display Down syndrome-specific templates for carrying capacity (K) and nonspecific Down syndrome (NS) binding. Maps of gray and white matter are displayed for visual reference. K images represent the theoretical limit for the Down syndrome brain to carry beta-amyloid plaques and are in strong agreement with known spatial distribution of plaques in Down syndrome. The highest values are located in the striatum and precuneus. Images courtesy of Zammit et al and SNMMI.
Both SUVr and beta-amyloid load increased with age, and both showed similar changes among study participants who already were PiB-positive or who converted to become PiB-positive, Zammit said. However, among PiB-negative cases, beta-amyloid load provided reduced longitudinal variability compared with SUV ratios.
"Furthermore, we found that the striatum revealed the highest capacity to carry [beta amyloid]," he added. "Since the striatum shows the earliest signs of accumulation, these findings further highlight the significance of this region in preclinical Alzheimer's classification for Down syndrome."