Location is everything. If recent research results are any indication, that old real-estate maxim also appears true for applying computer-aided detection (CAD) technology to the detection of prostate cancer.
A team led by Dr. Satish Viswanath of Case Western Reserve University found that CAD techniques performed differently depending on the specific region of the prostate being examined.
"Our results suggest that tuned, zone-specific [computerized decision-support] tools may be very useful to better assist the radiologist in identifying [peripheral zone] and [central gland] prostate cancer on [T2-weighted] MRI," Viswanath said.
He presented the team's findings during a scientific session at RSNA 2012.
While MRI has shown great promise for staging and detecting prostate cancer in vivo, manual interpretation of these studies for the presence and extent of cancer suffers from significant variability, Viswanath said. The use of computerized decision support (CDS) may help alleviate this issue by providing clinicians with an automated estimate of cancer presence and extent via a combination of image processing and pattern recognition tools.
Prostate cancer in different regions may have different appearances on MRI, however, and CAD technology has primarily focused on peripheral zone cancers to date, he said.
The research team, which included co-authors from Boston Medical Center, radiation oncology firm Accuray, UT Southwestern Medical Center, and Beth Israel Deaconess Medical Center, sought to develop an optimized CDS tool that could accurately detect both peripheral zone and central gland prostate tumors, even with only a limited number of training cases.
The researchers obtained 22 3-tesla, T2-weighted, preoperative, multiparametric MRI studies of prostate cancer patients using an endorectal coil on a Genesis Signa scanner (GE Healthcare). Of these 22 patients, six had biopsy-proven central gland prostate cancer, while 16 had confirmed peripheral zone prostate cancer.
To produce a voxel-by-voxel estimation of the ground truth for the extent of prostate cancer on MRI, the team applied coregistration methods to spatially align 80 MR images from the 22 datasets with their corresponding ex vivo whole-mount prostatectomy sections.
The researchers then employed a set of 20 quantitative textural features that were extracted on a per-voxel basis to model the appearance of prostate cancer in both the peripheral zone and the central gland. Next, they evaluated 12 different CAD classifiers, including quadratic discriminant analysis (QDA), support vector machine (SVM), Bayes, and decision-tree methods, in conjunction with the 20 textural features to test their ability to identify central gland and peripheral zone cancer on a per-voxel basis.
The performance of each of the CAD classifiers was evaluated using receiver operator characteristics (ROC) analysis.
"We found that different types of prostate tumors [in the central gland and peripheral zone] required the development of different types of classifier schemes within the CDS tool," he said.
 |
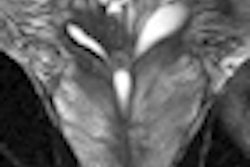
| Original T2-weighted prostate MR images for peripheral zone prostate tumor (left) and central gland prostate tumor (right). All images courtesy of Dr. Satish Viswanath. |
 |
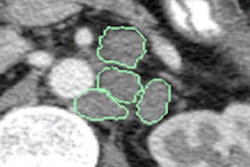
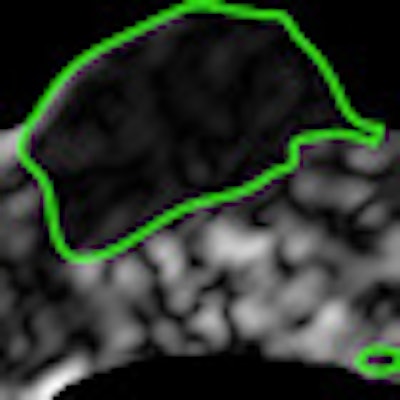
| Sample textural representations found to be highly discriminatory for peripheral zone tumor (left) and central gland tumor (right) show difference in texture with cancer region (green outline) and rest of prostate. |
 |
| Classification heat maps (above) show areas in red that correspond to a high probability of cancer. Green outlines on the previous textural representations correspond well with red regions on the heat maps. The authors found that different classifiers and features performed best for each central gland or peripheral zone cancer. |
With an area under the curve (AUC) of 0.87, the QDA classifier performed the best for detecting central gland prostate cancer. The boosted decision-tree classifier, however, performed the best (AUC = 0.75) for detecting peripheral zone cancer.
Notably, the frequently used SVM classifier turned in poor AUC in both central gland (0.71) and peripheral zone (0.55) prostate cancers, Viswanath said.
"A simple [QDA] classifier, known to be less dependent on the size and quality of the imaging data cohort, appears to yield higher prostate cancer detection accuracy in the [central gland] compared to more complex classifier schemes, such as the popular SVM scheme," he told AuntMinnie.com. "Similarly, the boosted decision-tree classifier significantly outperformed the SVM classifier for prostate cancer detection in the [peripheral zone]."
As a result, time and complexity requirements should be considered when developing computerized decision-support schemes, Viswanath said.