Computed Tomography of the Chest
Helical CT of the Chest:
Because it can survey the entire lung volume continuously during a single breath hold, helical scanning enhances the detection of lung nodules (through the use of retrospective reconstruction of overlapping sections) and reduces motion artifacts. For helical CT, the pitch defines the speed at which the patient's body is advanced through the scanner [25]. The pitch is defined as the length of travel by the imaging table during a single 360? rotation of the x-ray tube divided by the beam collimation (detector width) [25,29]. Thus, if the table traveled 15 cm during a single 360? gantry rotation and the beam collimation is 10 cm, the pitch would be 1.5:1 [25]. A pitch of less than 1 implies an overlapping x-ray beam [38]. For a pitch of 1:1 the table would travel a distance equal to the beam colliation during one tube rotation [25]. A higher pitch corresponds to a higher table speed and shorter exposure time and hence a lower radiation dose to the patient (at the cost of increased quantum noise) [25,33]. If all other parameters are held constant, the radiation dose is inversely proportional to the pitch in a linear fashion (doubling the pitch results in half the radiation dose) [33,35,38]. Note- for single source MDCT scanners using AEC will compensate for increase in pitch by increasing tube current (mA) to maintain a constant noise level [33]. Dual source CT scanners permit higher pitch rates without affecting image noise [29].
The slice, or reconstruction interval, is the distance between
the midpoints of adjacent slices. The acquired slice thickness
determines the minimum reconstructed slice thickness (the
reconstructed slice thickness will be a multiple of the acquired
slice thickness) [33]. The interval can be post-processed to be
either more than, equal to, or less than the collimation. If the
slice interval is more than the collimation, the slices will
have gaps in between. If the interval is less than the
collimation, the slices will be overlapping- this latter
capability of obtaining overlapping slices without increasing
the radiation dose to the patient is one of the major benefits
of helical CT and overlapping section reconstruction decreases
partial volume artifacts. Another benefit of helical CT is the
ability to obtain more uniformly consistent opacification of vessels with smaller
volumes of contrast, primarily because of the shorter imaging
times [1].
Another parameter, detector configuration, refers to the number of data channels used (number of slices acquired per rotation) AND the effective detector row thickness of each data channel [33]. The product of the number of data channels and the effective detector-row thickness determines the x-ray beam collimation [33]. A 64-slice scanner with 0.625mm detector rows produces a total beam collimation of 4.0 cm (64 x 0.625) [33]. Each time the CT gantry rotates, some radiation at the cranial and caudal edges of the beam falls beyond the detectors (the penumbra of the beam) which makes the incident x-ray beam about 2mm wider than the selected beam collimation or detector configuration [33]. The penumbra is not used for image formation and produces excess radiation dose refered to as "overbeaming" [33]. Because CT scanners ith more detectors cover a larger distance per rotation, they result in less overbeaming and less radiaiton exposure compared to scanners with fewer detectors [33]. Image noise is proportional to the reconstructed or nominal section thickness (T) by the equation 1/√ T . Therefore, a 2.5 mm thick section will have 1.4 more times noise than a 5mm section [33]. The radiation dose must change in inverse proportion to the slice thickness to maintain constant image noise for varying reconstructed slice thicknesses [33]. For example, a 2.5 mm thick section will require about twice as much radiationas a 5 mm thick slice to maintain the same image noise [33].
The mAs is a measure of the photon flux and is measured as the product of the tube current (in mA) and the exposure time (in seconds) [33]. The tube current, measured in milliamperes (mA), defines the number of electrons per second that traverse the CT x-ray tube during an exposure and is linearly related to the number of x-rays (photons) emitted per second and the radiation dose rate [25]. Therefore, for a particular exposure time, the radiation dose is directly related to the to the tube current [25]. The "number" or intensity of photons can be altered with modification of the tube current- increases in tube current increase the number of photns emitted from the x-ray tube and thereby increase radiation exposure [29]. Lengthening the duration of exposure by some factor without varying the current, results in an increased radiation dose by that same factor [25]. Generally, the tube current and the exposure time are expressed together and given by their product as mAs (milliampere-seconds) [25]. Radiation dose is directly proportional to the mAs if all other factors are held constant [33]. Thus- a 50% reduction in mAs will result in a 50% reduction in radiation exposure [33]. However, image noise is proportional to 1/√ mAs. Therefore, reducing the tube current from 400 to 200 mAs results in a 50% reduction in radiation exposure and a 41% increase in image noise [33].
The tube voltage is measured in kilovolt peak and determines
the energy of the x-rays hitting the target [25]. As the
electrons encounter attraction forces from the nuclei within the
target they "brake", change direction and release Bremsstrahlung
x-rays [29]. The emitted x-rays have a range of energies (energy
spectrum) dependent on the tube voltage and added filtration in
the x-ray beam [25]. In other words, the energy of the emitted
photnos is proportional to the energy of the incident electrons
[29]. Increasing the tube voltage increases the number of x-rays
produced, the energy range and the height of the continuous
energy spectrum [25,29]. This in turn increases the radiation
output and radiation dose [25]. At high kVp, high energy photons
are produced that have greater tissue penetration, less
attenuation, and this results in less contrast noise [29].
However, although there is a reduction in tissue absorption with
the higher energy photons, the increase in photon number
associated with the high kVp results in an increase in overall
x-ray exposure [29]. The radiation dose varies as the square of
the tube voltage [25]. For CT, the kVp
is typically maintained at 120-140 kVp
[25]. Radiation dose is proportional to kVp raised to an
exponential power of more than 2 (from 2.5 to 3.1 depending on
patient size) [33]. Decreasing the kVp from 140 to 120 reduces
the dose by 28-40% and decreasing it to 80 kVp reduces the dose
by about 65% [33]. Also, because the k-edge of iodine
(33.2 keV) is closer to 80 kVp than to 120-140 kVp, the
attenuation of contrast enhanced structures such as blood
vessels is significantly higher at 80 kVp [33]. Decreasing the
kVp from 120 to 100 kVp will increase vascular attenuaiton by
100 HU and decrease the radiation dose by more than 30% [38].
However, lowering the kVp results in increased noise- image
noise is proportional to 1 divided by the tube potention
[33,38]. Therefore, a reduction in tube potential from 120 to
100 kVp results in a 20% increase in image noise [38]. If
corrections for kVp are going to be made, the selection is best
based on the patient's body weight or BMI [38]. For angiographic
studies on patients less than 50 kg a peak of 80 kVp would be
appropriate, for 50-80 100 kVp, and for over 80 kg- 200 kVp
[38].
CT noise (quantum mottle) is determined primarily by the number
of photons used to make an image [24]. The quantum mottle
fraction decreases as the number of photons increases [24]. CT
noise is generally reduced by increasing the kVp, mA, or
scanning time [24]. If voltage is decreased, then mAs must be increased to provide the
appropriate number of x-rays at the detector to reduce image
noise- this increases the patient dose [25]. CT noise is also
reduced by increasing voxel size,
increasing reconstruction field of view, increasing section
thickness, or by image stacking [24]. Contrast is the difference
in HU values between tissues and tends to increase as kVp decreases [24]. It is less affected
by mA or scan time [24].
Milligray is a measure of the absorption of ionizing energy per
unit mass of matter and is measured in joules per kg [39].
Millisievert is a unit of effective radiation dose that is
dependent on both the amount of absorbed radiation (in
milligrays) and the relative radiosensitivity of the exposed
organ and it is meant to normalize stochastic risk by a
representative average whole-body dose [39].
CT scanners estimate the absorbed radiation dose delivered to each patient using the volume CT dose index (CTDIvol) and dose length product (DLP) [29,30]. CTDIvol refers to the average radiation dose to a standard 32 cm diameter plastic phantom over the volume scanned and is measured in mGy [29]. CTDIvol is independent of patient size and scan length and can simplistically be considered the average radiation output per slice of the CT scanner amd it depends only on the type of scanner and acquisition parameters such as x-ray tube peak kVp and the tube current product (mAs) [33]. Unfortunately, the CTDIvol is not a measurement of patient dose [32]- it is an estimate of the average radiation dose within a volume of tissue- should that tissue be the same size and attenuation as the plastic phantom [39]. A limitation of the CTDIvol measurement is that it is measured by using a standardized, cylindric, homogeneous phantom [31]. This phantom cannot reflect the wide variety in sizes, shapes, and attenuation characteristics of the human body [31]. Also- the CTDIvol reflects dose to air and not the dose to tissue [31]. Additional limitations are that the 14cm length of the phantom does not provide a sufficiently long scatter path when compared to a human torso and the current 10 cm intergration length is not adequate for beam widths greater than 10 cm [31]. Finally, the CTDIvol metric may not provide an accurate reflection of patient dose when radiation dose-saving technologies such as dose modulation are employed [32]. The CTDIvol displayed at the completion of a CT scan is an average CTDIvol over the scanned length [39].
DLP (mGy-cm) is calculated as the product of CTDIvol
and scan length (in cm) and is measured in milligray-cm [29,31].
DLP represents the integreated dose over the length of exposure
and reflects the total amount of radiation incident on the
patient [33]. DLP can then be mulitplied by a coefficient, based
on patient size (fsize),
which estimates the effective dose (individual patient absorded
dose) or size specific dose estimate (SSDE) in mSv [29,31]. The
effective dose is used to express risk to a patient from a
specific CT scan [30].
The absorbed dose refers to the actual patient dose and describes the amount of ionizing radiation that is deposited in tissue (energy [joule[ absorbed per unit mass [kg] expressed in milligrays) [39]. For any given exposure factors, the patient dose depends on patient size: the larger the patient, the smaller the patient dose due to radiation attenuation before reaching radiosensitive tissues [33]. Patient size is a critical variable for protocol optomization [34]. If the same CTDIvol is used to scan two differenty sized patients, the absorbed dose in the smaller patient is higher [39]. This is because the larger patient wil have a more diluted deposition of absorbed dose (the same dose distributed over a larger mass) than a smaller patient [39].
Effective dose is an estimate of the genetic risk to a generic
individual (both sexes, all ages, standardized-sized patient)
and does not represent the actual risk for any one individual
[39]. For average-sized adults scanned at 120 kV, multiplying
the DLP by 0.018 mSv/mGy-cm for body examinations will yield an
effective dose estimate [39]. For a rough estimate when reading
body CT studies, the effective dose is approximately 1.5% of the
DLP [39].
Size-specific dose estimate (SSDE) is a newer CT-derived value
in milligrays that incorporates patient size as a modifying
correction factor to better estimate patient dose [39]. SSDE is
determined by multiplying CTDIvolby a conversion
factor based on the patient's effective diameter [39]. The
ffective diameter is defined as the square root of the product
of the anterior-posterior and lateral patient diameter [39].
The use of contrast media has been shown to enhance he amount of cellular radiation damage (DNA double strand breaks) associated with CT imaging [26].
Automatic tube current modulation
Automatic tube current modulation (ATCM) adapts the tube
current (mA) according to the patient's body habitus to maintain
a selected image quality at all anatomic locations using the
minimum required radiation exposure [29]. It reduces the tube
current in projections with less attenuation while maintaining a
constant signal to noise ratio [29]. ATCM can be applied with
either angular (x- and y-axis) or longitudinal (z-axis) modes of
modulation [36].
Angular modulation (x-y axis) adjusts current as a function of
the projection angle taking into account differences between the
usually larger coronal and small sagittal diameter of the
chest/body [36,38]. For low-attenuation projection angles in the
anteroposterior direction, current is reduced, and for
high-attenuation projection angles in the lateral direction,
current is increased thereby maintaining a constant photon flux
[36,37,38]. Other adjustments in angular ACTM by further
decreasing anterior current with respect to posterior current
during CT gantry rotation can lower the dose delivered to
critical organs such as the cornea, thyroid, and breasts [36].
This method has shown a possible 27-50% dose savings to the
radiosensitive anterior organs [36].
Longitudinal or Z-axis modulation adjusts current (mA) based on
differences in body composition along the longitudinal
(cranio-caudal) axis of the patient to maintain a specified
quantum noise level (noise index) [36,37,38]. When differences
in tissue density are detected, current is altered to achieve
the desired noise index/level [36]. With this method, lower
attenuation portions of the body are imaged with a lower mA than
higher attenuation portions [37]. Therefore, z-axis modulation
will generate CT images with similar noise, irrespective of
patient size or anatomy [36]. Depending on the noise index,
z-axis modulation can result in 1 16-26% reduction in tube
current [36]. However, z-axis modulation can sometimes result in
increased radiation exposure- particularly in obese patients
[36]. When selecting a noise index for a CT protocol it is
important to know the reconstruction section thickness at which
the noise index is applied since to maintain the same image
noise, the radiaiton dose would have to be increased for the
reconstruction of tuin sections compared to thick sections [37].
Protocol specific image optimization is very important. Remember
that for evaluation of soft tissue abnormalities such as the
detection of liver metastases, the images require
differentiation of small CT number differences from background
noise (superior low-contrast detectability), while CT
angiography is not as affected by image noise due to the large
contrast differences [37].
Some CT scanners are equipped with combined angular and z-axis
modulation [36].
Automated exposure control techniques have enabled a 30%
radiation reduction in pediatric patient populations [29]. Note
that the combined use of ATCM and breast shields can lead to
unpredictable and potentially undesireable dose and image
quality [36]. When sensing the breast shield, ATCM responds by
increasing current and overall radiaiton dose [36]. It has
clearly been shown that similar dose reductions to
anterior-surface radiosensitive organs can be attained solely
with the use of ATCM [36].
Partial TCM (or ogan-specific dose modulation) in chest CT and
CTPE imaging allows reduction of current to the anterior chest
to decrease radiation to breast tissue (resulting in a 35-39%
reduction in breast radiation dose [38]. The drawback of this
technique is the compensatory increase in radiation to the
back/spine to sustain a constant noise level [38].
Beam-shaping or Bowtie filters
In the CT beam, photons at the lateral aspects of the patient
typically have less tissue to travek through and are therefore
less attenuated [36]. The filter serves to attenuate these
lateral photons to decrease photon scatter and dose to the skin
[36].
Iterative reconstruction
Iterative reconstruction produces high quality images at lower
tube currents [33]. Using this technique, dose reductions up to
65% have been reported for abdominal imaging [33].
However, images recontructed with iterative reconstruction have
an altered texture with a smoothed appearance [37]. The degree
of smoothing increases with the degree of noise suppression
used, which can lead to reduced sharpness of organ margins, a
smoothed appearance of solid organs, and reduced perception of
small objects [37].
Image Reconstruction:
Overlapping reconstruction with at least 50-60% overlap (4 or 5 mm sections reconstructed at a minimum of 2 to 3 mm intervals) will minimize aliasing and stairstep artifacts on 3D and MPR views.
Maximum Intensity Projection Reconstructions:
The MIP technique (maximum intensity projection) is a 3D reconstruction that depicts only the highest-attenuation picture units (voxels) within a slab of data. If the threshold of brightness is selected for IV contrast material, all other superimposed structures that are above (such as bone) or below (such as soft tissue and lung) the threshold values are eliminated and only a two dimensional angiographic image will remain. With this technique, there is improved blood vessel conspicuity along greater portions of the vessel length. It is the only view that allows differentiation of calcification from contrast material. This technique can also aid the detection and differentiation of micronodules from small vessels.
Minimum Intensity Projection Reconstructions:
The minimum intensity algorithm enables pixels to encode the
minimum encountered voxel value
during reconstruction along each ray. Minimumintensity
projection images suppress high attenuation background including
pulmonary vessels and lung fissures [41]. Such images can aid in
the detection of areas of emphysema, however, the images are
more susceptible to motion and pulsation artifacts. Motion and
pulsation will create areas of hypoattenuation
that can mimic emphysematous change. Cardiac pulsation artifact
is usually recognized by its paramediastinal
/ paracardiac location. Breathing
artifacts cannot be accurately recognized unless standard CT
images are also available for review [2]. These images can also
improve visualization of abnormal increases in lung densitym
such as ground glass attenuation nodules [41].
Ray-Sum Projection Reconstructions:
The ray-sum projection displays the sum of pixel values along vectors or rays projected through the model and it is the most analogous in appearance to conventional arteriograms. It has a relative translucent appearance that allows superimposed vessels to be seen through one another. It is important to remember that thresholding and disarticulation used for reconstruction may introduce artifacts such as pseudostenoses. The lower threshold should not be set above approximately 50-60% of the peak vascular enhancement- raising the threshold further may erode the vessels and create false areas of stenosis.
3D Volume rendering:
High opacity values produce an appearance similar to surface rendering, and low opacity values allow the user to "see through" structures [23]. 3D VR imaging has been suggested to be superior to MIP for the detection of small solid intrapulmonary nodules [23].
High Resolution CT of the
Lungs:
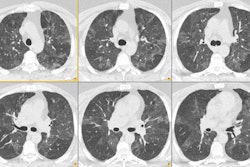
HRCT is most often performed in the evaluation of patients with suspected diffuse lung disease. Up to 10% of patients with interstitial lung disease may have a normal CXR. Between 20 to 30% of these individuals will be shown to have interstitial disease by HRCT. Additionally, HRCT has been shown to be of great value in directing biopsy to regions with the appearance of most active disease. It is important to remember that HRCT provides macroscopic, not microscopic information. Findings on HRCT do however often reflect histologic appearances and distribution of disease.
High resolution CT of the lungs utilizes thin collimation (1-1.5 mm), image reconstruction with a high spatial frequency (bone algorithm), and increased kVp or mA technique (kVp 120-140, mA 140-240, and mAs 240-400). The high spatial frequency reconstruction reduces image smoothing and increases spatial resolution which allows structures to appear sharper. Although this technique does make image noise more apparent, much of the noise is quantum related and will decrease with increased technique (kVp, mA). Low dose HRCT using 120 kVp and 20-60 mA has also been performed and provides diagnostic information comparable to the conventional high resolution technique. Still, for large patients, patients with suspected posterior lung disease, and for initial patient evaluation, the use of conventional technique is recommended. The largest matrix available should be used for image reconstruction (typically 512 x 512). Retrospectively targeting reconstruction to a single lung instead of the entire thorax by using a smaller field of view, will significantly reduce the image pixel size and increase spatial resolution. Current scanners are capable of providing a spatial resolution of 0.5 mm (pixel size of 0.25 mm). Partial rotation reconstruction of HRCT images using 0.3 sec results in reduced cardiac motion artifacts, although images can appear more noisy [22]. Reconstructed high-resolution images generated from a MDCT data acquisition are comparable to conventional axial high-resolution images, however, ground-glass attenuation is significantly better delineated on axial images [20].
Lung attenuation is greater in dependent lung than in non-dependent lung (typically between 50-100 HU) [9]. Because patients that are positioned supine within the scanner may demonstrate dependent densities (sub-pleural lines) that can mimic interstitial lung disease, a number of protocols have been described to permit adequate evaluation of the lungs. One option is to scan the lungs in full inspiration in the supine position, and then obtain 3 selected slices (arch, carina, and 2 cm above the right hemidiaphragm) with the patient prone. Alternatively, supine and prone scanning each at 2 cm spacing could be performed. Expiratory scans at 3 selected levels are usually sufficient to demonstrate significant air trapping.
Images should be reviewed using "lung windows" which are typically a level of -600 to -700 and a window of 1000 to 1500. For evaluating the hila, mediastinum, or pleura, a level of 50 and window of 350 is best. A low level setting (-800 to -900) and a narrow width (500) can aid in the detection of emphysema. These recommendations should serve as guidelines- individuals should select settings which they find to be the most useful for their equipment.
For PACS reading, a 3:1 compression ratio has been reported to produce visually lossless images [21]. Images degradation and potential loss of diagnostic information can be seen at higher compression ratios [21].
Air Trapping:
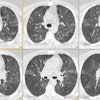
Click here to view an example of air trapping
HRCT has been shown to be of value in confirming the presence of air trapping. In the majority of normal subjects, lung attenuation increases in a homogeneous fashion during exhalation with an average increase of about 200 HU. In the presence of air-trapping lung parenchyma remains lucent on expiration and shows little change in volume. Trapping is considered to be present when the lung fails to increase normally in attenuation during exhalation. An increase in attenuation of less than 100 HU is indicative of air-trapping. Air trapping is associated with bronchiolitis obliterans, asthma, chronic bronchitis, sarcoidosis, and hypersensitivity pneumonitis [12,14].
Normal subjects (between 52-84% [8,15,17]) can show focal areas of relative lucency (typically fewer than 3 adjacent secondary pulmonary lobules [15]) on expiratory HRCT images that are indicative of air trapping- most commonly localized to the lingula, superior segments of the lower lobes, lower lobes, and dependent lung regions [4]. The frequency of air trapping increases with age (up to 76% of patients over the age of 61 years [27]) and is also higher in patients with a greater than 10 pack year smoking history [8,27]. The extent of air trapping is usually small (under 5% of the total lung area) in asymptomatic patients [8], however, extensive air trapping and mosaic air trapping can be observed in patients with normal pulmonary function testing (up to 25% of the lung parenchyma in one study [27]) [17]. Larger areas of air trapping (segmental and lobar) are more commonly found in smokers or ex-smokers [15]. In smokers, air trapping appears to be related to inflammatory infiltration of the smooth muscle layer of the small air ways [18]. An increased incidence of focal air trapping on expiratory CT has also been observed in HIV-positive individuals. The severity of focal air trapping is related to duration of HIV infection, and inversely related to CD4 count, suggesting that airway damage is progressive in these individuals [13].
Intralobular Interstitial Thickening:
Thickening of the intralobular interstitium produces a fine reticular or mesh-like pattern in the sub-pleural lung periphery. It is also referred to as the small reticular pattern. Intralobular bronchioles are often visible in patients with this type of fibrosis because of traction bronchiolectasis.
Interlobular interstitial thickening:
Thickening of the interlobular septa can be seen in conditions associated with infiltration of the pulmonary interstitium by cells, fluid, or fibrosis; infiltration of the pulmonary lymphatics; or conditions associated with dilatation of the pulmonary veins [19]. A basal subpleural reticular pattern can be seen in up to 60% of healthy individuals over the age of 75 years (but should not be seen in patients under the age of 55 years) [27]. Individuals over the age of 75 may also demonstrate scattered thin walled cysts [27].
Peribronchovascular Interstitium:
The peribronchovascular interstitium is the connective tissue that surrounds the bronchi and pulmonary vessels and it is present from the hilar regions to the level of the terminal or respiratory bronchiole (although it thins as it travels peripherally in the lung). Within the peribronchovascular interstitium is an abundant network of bronchial arteries, veins, and lymphatics. The interstitium usually appears as a thin band of low density attenuation adjacent to the major bronchi and vessels. It typically has a concave or straight margin and it is typically not visualized beyond the segmental bronchi even with the use of HRCT. Diseases that spread along lymphatic channels such as lymphangitic carcinomatosis and sarcoid commonly produce abnormalities of the peribronchovascular interstitium [7].
Honeycombing:
Click here to view an example of honeycombing
Honeycombing is defined by the presence of small airway cystic spaces, generally lined by bronchiolar epithelium, and having thick walls composed of fibrous tissue. Honeycombing indicates the presence of end-stage pulmonary fibrosis. The cystic spaces average about 3-10 mm in size (range from 3 mm to 2.5 cm) and have clearly defined walls of 1 to 3 mm in thickness. Honeycombing typically predominates in the peripheral and sub-pleural lung. Honeycombing is often associated with other findings of lung fibrosis such as intralobular interstitial thickening and traction bronchiectasis. Superimposition of emphysema and dependent density may occasionally mimic honeycombing when the patient is supine. This finding should clear when the patient is scanned in the prone position.
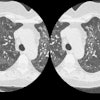
Ground Glass Areas of
Attenuation:
Click here to view example of ground glass attenuation
Ground glass opacity is defined as a region of increased lung attenuation not obscuring the underlying vessels. Ground glass opacification is a very non-specific finding. It is produced by any infiltrative process within the interstitium of the lung or partial filling of the air spaces by fluid, cells, or fibrosis so that the CT attenuation of the affected lung increases compared with that of the normal lung parenchyma. The caliber and number of vessels are not appreciably different between the normal and abnormal regions of lung [5]. Although it is non-specific, ground-glass opacity usually (80%) indicates an acute, active, and potentially treatable process.
Ground glass mimicks: Ground-glass opacities (GGO) may occur artifactually. Certain technical parameters may also produce GGO. Narrow window width and level can also result in GGO- a recommended range for viewing the lung parenchyma is a window width of 1500-2000 and a level of -500 to -700. A tube current that is too low will produce excessive noise which can mimic GGO- generally a current of 240-400 mA is acceptable. Collimation should be 1.0-1.5 mm because GGO may occur when areas of parenchymal opacification are volume averaged with the thicker slices, or it may not be visualized at all, also due to volume averaging [10]. Low lung volumes may produce areas of ground glass attenuation and all HRCT exams should be performed at deep inspiration to avoid this problem. The tracheal configuration changes from round in inspiration to flat or cresant-shaped in expiration and it can be used to determine whether the exam was poerformed in inspiration or expiration. Bronchoalveolar lavage has also been shown to produce areas of ground glass attenuation for up to 24 hours following the procedure. Cardiac and respiratory motion can create GGO, but blurring and double images of vessels and fissures will help to confirm the presence of motion.
CT performed at suspended full expiration and sometimes on inspiratory scans can show the physiologic consequence of small airway (bronchiolar) disease- air trapping. Lung regions that retain air during exhalation remain more lucent and show less decrease in volume than lung supplied by normal airways. Adjacent normal areas of lung may appear to have increased attenuation (GGO) in this situation. Frequently, these patients will have associated findings of airways disease such as bronchiectasis in the hyperlucent regions. Hypoxic vasocontriction will result in decreased vascular size and markings within the hyperlucent regions.
In pulmonary thromboembolic disease regions of hyperemic lung (higher attenuation) mimic ground glass infiltrates when seen adjacent to oligemic (lower attenuation) regions of lung. The oligemic lung, however, will show a decrease in the caliber and number of pulmonary vessels compared to normal lung. (See also "mosaic pattern of lung attenuation" below)
Findings which aid in the identification of true areas of ground glass attenuation include prominent septal lines within the region of abnormality, a poorly marginate/non-anatomic distribution, and normal vessel caliber within the involved region. Occasionally, a mixed pattern of both ground glass opacification and air-trapping can be seen. Etiologies which can produce this combination of findings include infection (mycoplasma), hypersensitivity penumonitis, and sarcoid.
Click here for
the differential diagnosis of ground-glass opacification
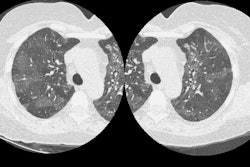
Mosaic Pattern of Lung
Attenuation:
Click here to view examples of mosaic attenuation
A mosaic pattern is produced by the patchy distribution of areas of increased and decreased lung attenuation. A moasic attenuation pattern may reflect the presence of underlying small airway disease, pulmonary vascular disease, or ground-glass interstitial or air space infiltrates. The mosaic pattern observed in small airway disease is related to both air trapping and hypoxic vasoconstriction (which can result in small or fewer visible pulmonary vessels). Expiratory images can be used to confirm the presence of air trapping. Up to 20% of patients with evidence of air trapping on expiratory images will have normal inspiratory exams [11]. Airway abnormalities (bronchial wall thickening or dilatation) are a common finding in these cases.
The mosaic pattern produced from underlying pulmonary vascular disease (chronic thromboembolic disease or pulmonary arterial hypertension) results from regions of hyperemic lung (higher attenuation) seen adjacent to oligemic regions (low attenuation). The oligemic lung will demonstrate a decrease in the caliber and number of vessels in comparison to normal lung, but will demonstrate increased attenuation on expiratory images (ie: show no evidence of air trapping). Also, signs of pulmonary arterial hypertension (enlarged arteries) can aid in the diagnosis.
Finally, areas of ground glass attenuation due to either air-space or interstitial infiltrates when viewed next to normal lung may also produce a mosaic pattern. In this situation, however, the caliber and number of vessels is similar to that in normal lung [6].
Mixed Disease: "Head cheese" Sign
In some patients inspiratory scans can show a mixture of several types of abnormality- ground-glass opacity, consolidation, normal lung, and mosaic attenuation. This combination has been termed the "head cheese" sign because of its resemblence to a particular sausage [12]. The mixed pattern is usually indicative of a combination of infiltrative and obstructive lung disease (best appreciated on expiratory images). The most common causes of this pattern are hypersensitivity pneumonitis, sarcoidosis, and infections associated with bronchiolitis.
Parenchymal Bands:
This term is used to describe non-tapering linear densities within the lungs from 2 to 5 cm in length that are often located in the lung periphery and frequently contact the pleural surface. The bands may represent continuous thickened interlobular septa, but those that are several millimeters thick, may represent coarse scars or atelectasis.
Sub-pleural Lines:
A subpleural line is a thin (1-2 mm) curvilinear opacity which is less than 1 cm from the pleural surface and parallels the pleura. These lines may be the result of the confluence of peribronchiolar interstitial abnormalities- representing early fibrosis with alveolar collapse. However, these lines may be seen in normal patients as a result of thin focal atelectasis within dependent lung (the abnormality disappears in these patients when placed prone).
Tree-in-bud Appearance:
Click here to view an example of a tree-in-bud" appearance
On HRCT abnormal bronchioles filled with fluid, mucus, or pus can appear as centrilobular tubular, branching, or nodular structures. These can be associated with centrilobular opacities if inflammation of the adjacent lung is present. This combination of fluid or pus filled bronchioles and surrounding inflammation has been described as the "tree-in-bud" appearance [16]. Disorders associated with a tree-in-bud appearance include infection such as endobronchial spread of mycobacterium tuberculosus (classically), atypical mycobacterial infection, as well as bacterial, viral, or fungal infection [16]. Congenital disorders associated with small airways disease can also produce a tree-in-bud appearance and include cystic fibrosis, dyskinetic cilia syndrome, yellow nail syndrome, and immunodeficiency states [16]
Click here to view the differential for a "tree-in-bud" appearance
Nodules:
The distribution of pulmonary nodules on HRCT are : (1) centrilobular
(including bronchiocentric and angiocentric), (2) perilymphatic,
and (3) random (19). Nodules that are bronchiocentric
in distribution are related to the centrilobular
bronchi, and angiocentric nodules
are related to the pulmonary arteries within the secondary
pulmonary lobule [19]. Because the artery and bronchus are in
close proximity both of these types of nodules appear in or very
near the center of the secondary pulmonary lobule and the two
are not readily distinguishable on HRCT [19]. Hence- bronchiocentric and angiocentric nodules are grouped
together as "centrilobular nodules"
[19].
Truncation
Atifact:
When the x-ray beam passes through the patient it is attenuated
by the entire soft-tissue thickness located within the gantry
[40]. For larger patients, excess soft tissue may fall outside
the scan field of view, but the scanner reconstruction algorithm
will assume that all of the attenuation occurred within the scan
field of view [40]. As a result, the periphery of the
reconstructed image will appear to have substantially higher
attenuation, generating a truncation artifact [40]. This
artifact can be potentially overcome by applying the options for
an expanded field of view to include all of the soft tissues,
however, the acquired images may not be of diagnostic quality
[40]. On PET/CT truncation will affect the SUV measurement [40].
REFERENCES:
(1) Radiol Clin North Am, July 94, p.759-774
(2) Radiology 1996; 200: 665-671
(4) Radiol Clin North Am 1994 Jul;32(4):745-757
(5) AJR 1995 Oct;165(4):813-816
(7) AJR 1996 Feb;166(2):309-312
(6) J Thorac Imag 1995, 10:p.294-297
(8) Radiology 2000; Lee KW, et al. Correlation of aging and smoking with air trapping at thin-section CT of the lung in asymptomatic subjects. 214: 831-836
(9) AJR 1997; Volpe J, et al. High-resolution CT of the lung: Dtermination of the usefulness of CT scans obtained with the patient prone based on plain radiographic findings. 169: 369-374
(10) AJR 1997; Collins J, Stern EJ. Ground-glass opacity at CT: The ABC's. 169: 355-367
(11) AJR 1998; Arakawa H, et al. Air trapping on expiratory high-resolution CT scans in the presence of inspiratory scan abnormalities: Correlation with pulmonary function tests and differential diagnosis. 170: 1349-1353
(12) Society of Thoracic Radiology Annual Meeting 2000; Webb WR. High-resolution CT: Inhomogeneous lung opacity. 57-60
(13) Society of Thoracic Radiology Annual Meeting 2000 Course Syllabus; King MA. Lung disease in HIV-positive individuals without AIDS. 105-107
(14) AJR 2000; Arakawa H, et al. Expiratory high-resolution CT: Diagnostic value in diffuse lung disease. 175: 1537-1543 (No abstract available)
(15) Radiology 2001; Mastora I, et al. Thin-section CT finding in 250 volunteers: Assesment of the relationship of CT findings with smoking history and pulmonary function test results. 218: 695-702
(16) Radiology 2002; Eisenhuber E. The tree-in-bud sign. 222: 771-772 (No abstract available)
(17) Radiology 2003; Tanaka N, et al. Air trapping at CT: high prevalence ub asymptomatic subjects with normal pulmonary function. 227: 776-785
(18) Radiology 2003; Berger P, et al. Structure and function of small airways in smokers: relationship between air trapping at CT and airway inflammation. 228: 85-94
(19) Radiol Clin N Am 2005; Gotway MB, et al. High-resolution CT of the lung: patterns of disease and differential diagnoses. 43: 513-542
(20) AJR 2005; Studler U, et al. Image quality from high-resolution CT of the lung: comparison of axial scans and sections from volumetric data acquired using MDCT. 185: 602-607
(21) Radiology 2006; Ringl H, et al. JPEG2000 compression of thin-section CT images of the lung: effect of compression ratio on image quality. 240: 869-877
(22) AJR 2006; Ha HI, et al. Effects of high-resolution CT of the lung using partial versus full reconstruction on motion artifacts and noise. 187: 618-622
(23) Radiology 2007; Peloshek P, et al. Pulmonary nodules: sensitivity of maximum intensity projection versus that of volume rendering 3D multidetector CT data. 243: 561-569
(24) AJR 2007; Kroft LJM, et al. Artifacts in ECG-synchronized MDCT coronary angiography. 581-591
(25) J Nucl Med 2009; Fahey FH. Dosimetry of pediatric PET/CT. 50: 1483-1491
(26) Radiology 2009; Grudzenski S, et al. Contrast medium-enhanced radiation damage caused by CT examinations. 253: 706-714
(27) Radiology 2010; Hansell DM. Thin-section CT of the lungs: the hinterland of normal. 256: 695-711
(28) AJR 2011; Arakawa H, Honma K.
Honeycomb lung: history and current concepts. 196: 773-782
(29) J Nucl Cardiol 2011; Small GR, et al. Established and
emerging dose reduction methods in cardiac computed tomography.
18: 570-579
(30) J Cardiovasc Comput Tomogr 2012; Simprini LA, Taylor AJ.
Cardiac CT in women: clinical application and considerations. 6:
71-77
(31) Radiology 2012; Bankier AA, Kressel HY. Through the
looking glass revisited: the need for more meaning and less
drama in the reporting of dose and dose reduction in CT. 265:
4-8
(32) Radiology 2012; Boone JM, et al. Radiation Exposure from
CT Scans: How to Close Our Knowledge Gaps, Monitor and Safeguard
Exposure--Proceedings and Recommendations of the Radiation Dose
Summit, Sponsored by NIBIB, February 24-25, 2011. 265: 544-554
(33) AJR 2013; Maldjian PD, Goldman AR. Reducing radiation dose
in body CT: a primer on dose metrics and key CT technical
parameters. 200: 741-747
(34) AJR 2013; Goldman AR, Maldjian PD. Reducing radiation dose
in body CT: a practical approach to optimizing CT protocols.
200: 748-754
(35) AJR 2013; Zacharias C, et al. Pediatric CT: strategies to
lower radiation dose. 200: 950-956
(36) AJR 2013; Costello JE, et al. CT radiation dose: current
controversies and dose reduction strategies. 201: 1283-1290
(37) Radiographics 2014; Kaza Rk, et al. Emerging techniques
for dose optimization in abdominal CT. 34: 4-17
(38) Radiographics 2014; Litmanovich DE, et al. Dose reduction
in cardiothoracic CT: review of currently available methods. 34:
1469-1489
(39) Radiology 2014; Mayo-Smith WW, et al. How I do it:
managing radiation dose in CT. 273: 657-672
(40) Radiographics 2016; Fursevich DM, et al. Bariatric CT
imaging: challenges and solutions. 36: 1076-1086
(41) AJR 2019; Li W, et al. Effect of slab thickness on the
detection of pulmonary nodules by use of CT maximum and minimum
intensity projection. 213: 562-567